

Question: [Instruction: Key the alphabet (A, B, C, D, E, or F) that represents your answer into the blank.] The red normal curve in the figure

![that represents your answer into the blank.] The red normal curve in](https://s3.amazonaws.com/si.experts.images/answers/2024/06/6674a89e42c3d_3746674a89e12b98.jpg)
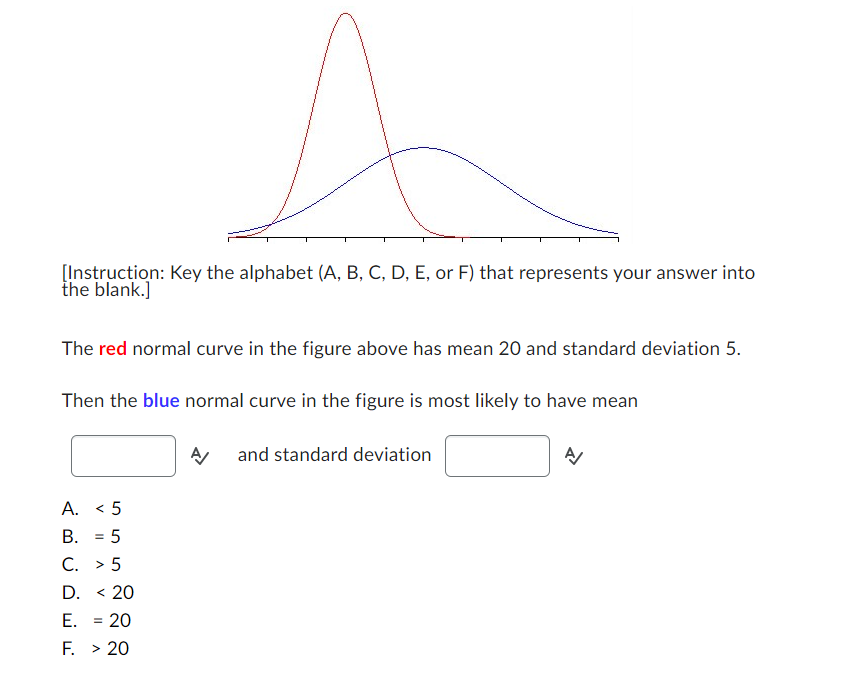
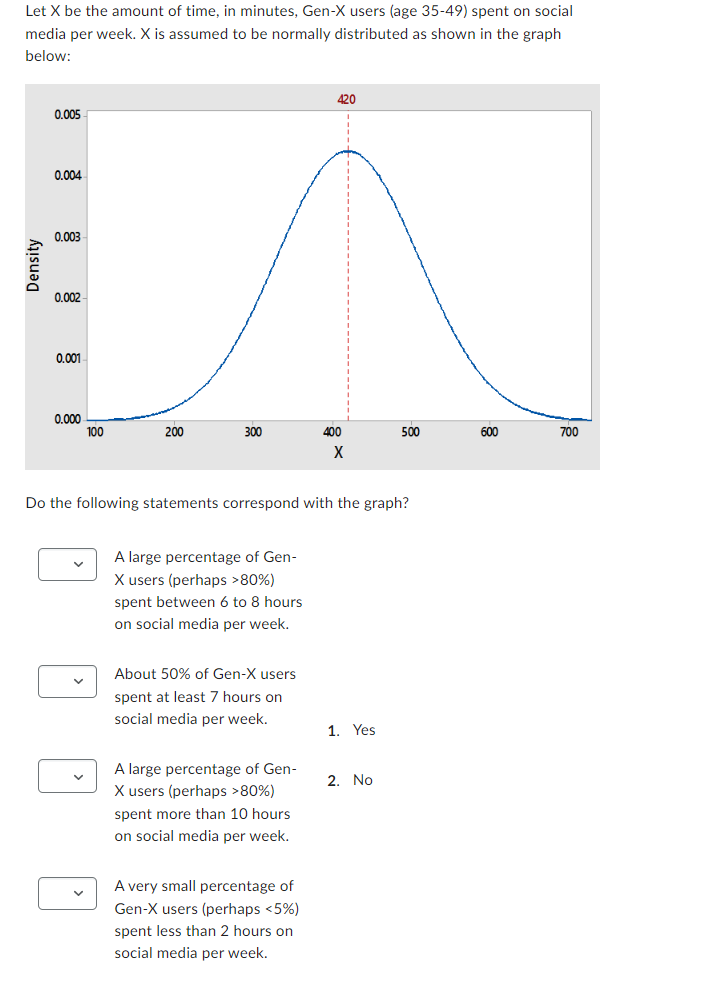
[Instruction: Key the alphabet (A, B, C, D, E, or F) that represents your answer into the blank.] The red normal curve in the figure above has mean 20 and standard deviation 5. Then the blue normal curve in the figure is most likely to have mean A/ and standard deviation A/ A. 5 D. 20Let X be the amount of time, in minutes, Gen-X users (age 35-49) spent on social media per week. X is assumed to be normally distributed as shown in the graph below: 420 0.005 0.004 0.003 Density 0.002 0.001 0.000 100 200 300 400 500 600 700 X Do the following statements correspond with the graph? A large percentage of Gen- X users (perhaps >80%) spent between 6 to 8 hours on social media per week. About 50% of Gen-X users spent at least 7 hours on social media per week. 1. Yes v A large percentage of Gen- 2. No X users (perhaps >80%) spent more than 10 hours on social media per week. A very small percentage of Gen-X users (perhaps
Step by Step Solution
There are 3 Steps involved in it

Get step-by-step solutions from verified subject matter experts