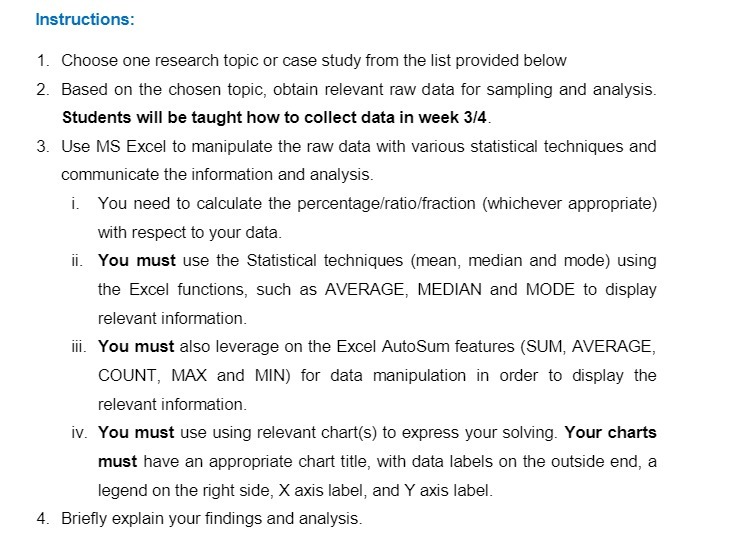
Question: Instructions: 1. Choose one research topic or case study from the list provided below 2. Based on the chosen topic, obtain relevant raw data for

Instructions: 1. Choose one research topic or
Instructions: 1. Choose one research topic or case study from the list provided below 2. Based on the chosen topic, obtain relevant raw data for sampling and analysis. Students will be taught how to collect data in week 3/4. 3. Use MS Excel to manipulate the raw data with various statistical techniques and communicate the information and analysis. i. You need to calculate the percentage/ratio/fraction (whichever appropriate) with respect to your data. ii. You must use the Statistical techniques (mean, median and mode) using the Excel functions, such as AVERAGE, MEDIAN and MODE to display relevant information. iii. You must also leverage on the Excel AutoSum features (SUM, AVERAGE, COUNT, MAX and MIN) for data manipulation in order to display the relevant information. iv. You must use using relevant chart(s) to express your solving. Your charts must have an appropriate chart title, with data labels on the outside end, a legend on the right side, X axis label, and Y axis label. 4. Briefly explain your findings and analysis

Step by Step Solution

There are 3 Steps involved in it

1 Expert Approved Answer
Step: 1 Unlock blur-text-image
Question Has Been Solved by an Expert!

Get step-by-step solutions from verified subject matter experts

Step: 2 Unlock
Step: 3 Unlock

Students Have Also Explored These Related Finance Questions!