

Question: Instructions: 1 . Understand the Data: - Review the provided data tables for each forecasting technique ( Na ve Forecasting, 2 - point Moving Average,
Instructions:
Understand the Data:
Review the provided data tables for each forecasting technique Nave Forecasting, point Moving Average, and point Moving Average
Note the actual values A and the forecasted values F for each period.
Calculate Forecasting Accuracy Metrics: For each forecasting technique, calculate the following:
Mean Absolute Deviation MAD
Mean Squared Error MSE
Mean Absolute Percentage Error MAPE
Analyze Results:
Summarize the MAD, MSE, and MAPE values for each forecasting technique in a table.
Identify which forecasting method has the lowest MAD, MSE, and MAPE values.
Answer the Question:
Based on your calculations, determine which forecasting technique is the most accurate. Justify your answer using the calculated metrics.
Submit Your Work:
Include your detailed calculations for MAD, MSE, and MAPE for each technique.
Use word document for this assignment.
Provide a short written conclusion about which forecasting technique is the most accurate and why.
Present your findings in a clear and organized format eg tables, and explanations
Submit you work on or before : pm of January
Example Table for Results:
Technique MADMSEMAPE
Nave Forecasting
point Moving Average
point Moving Average
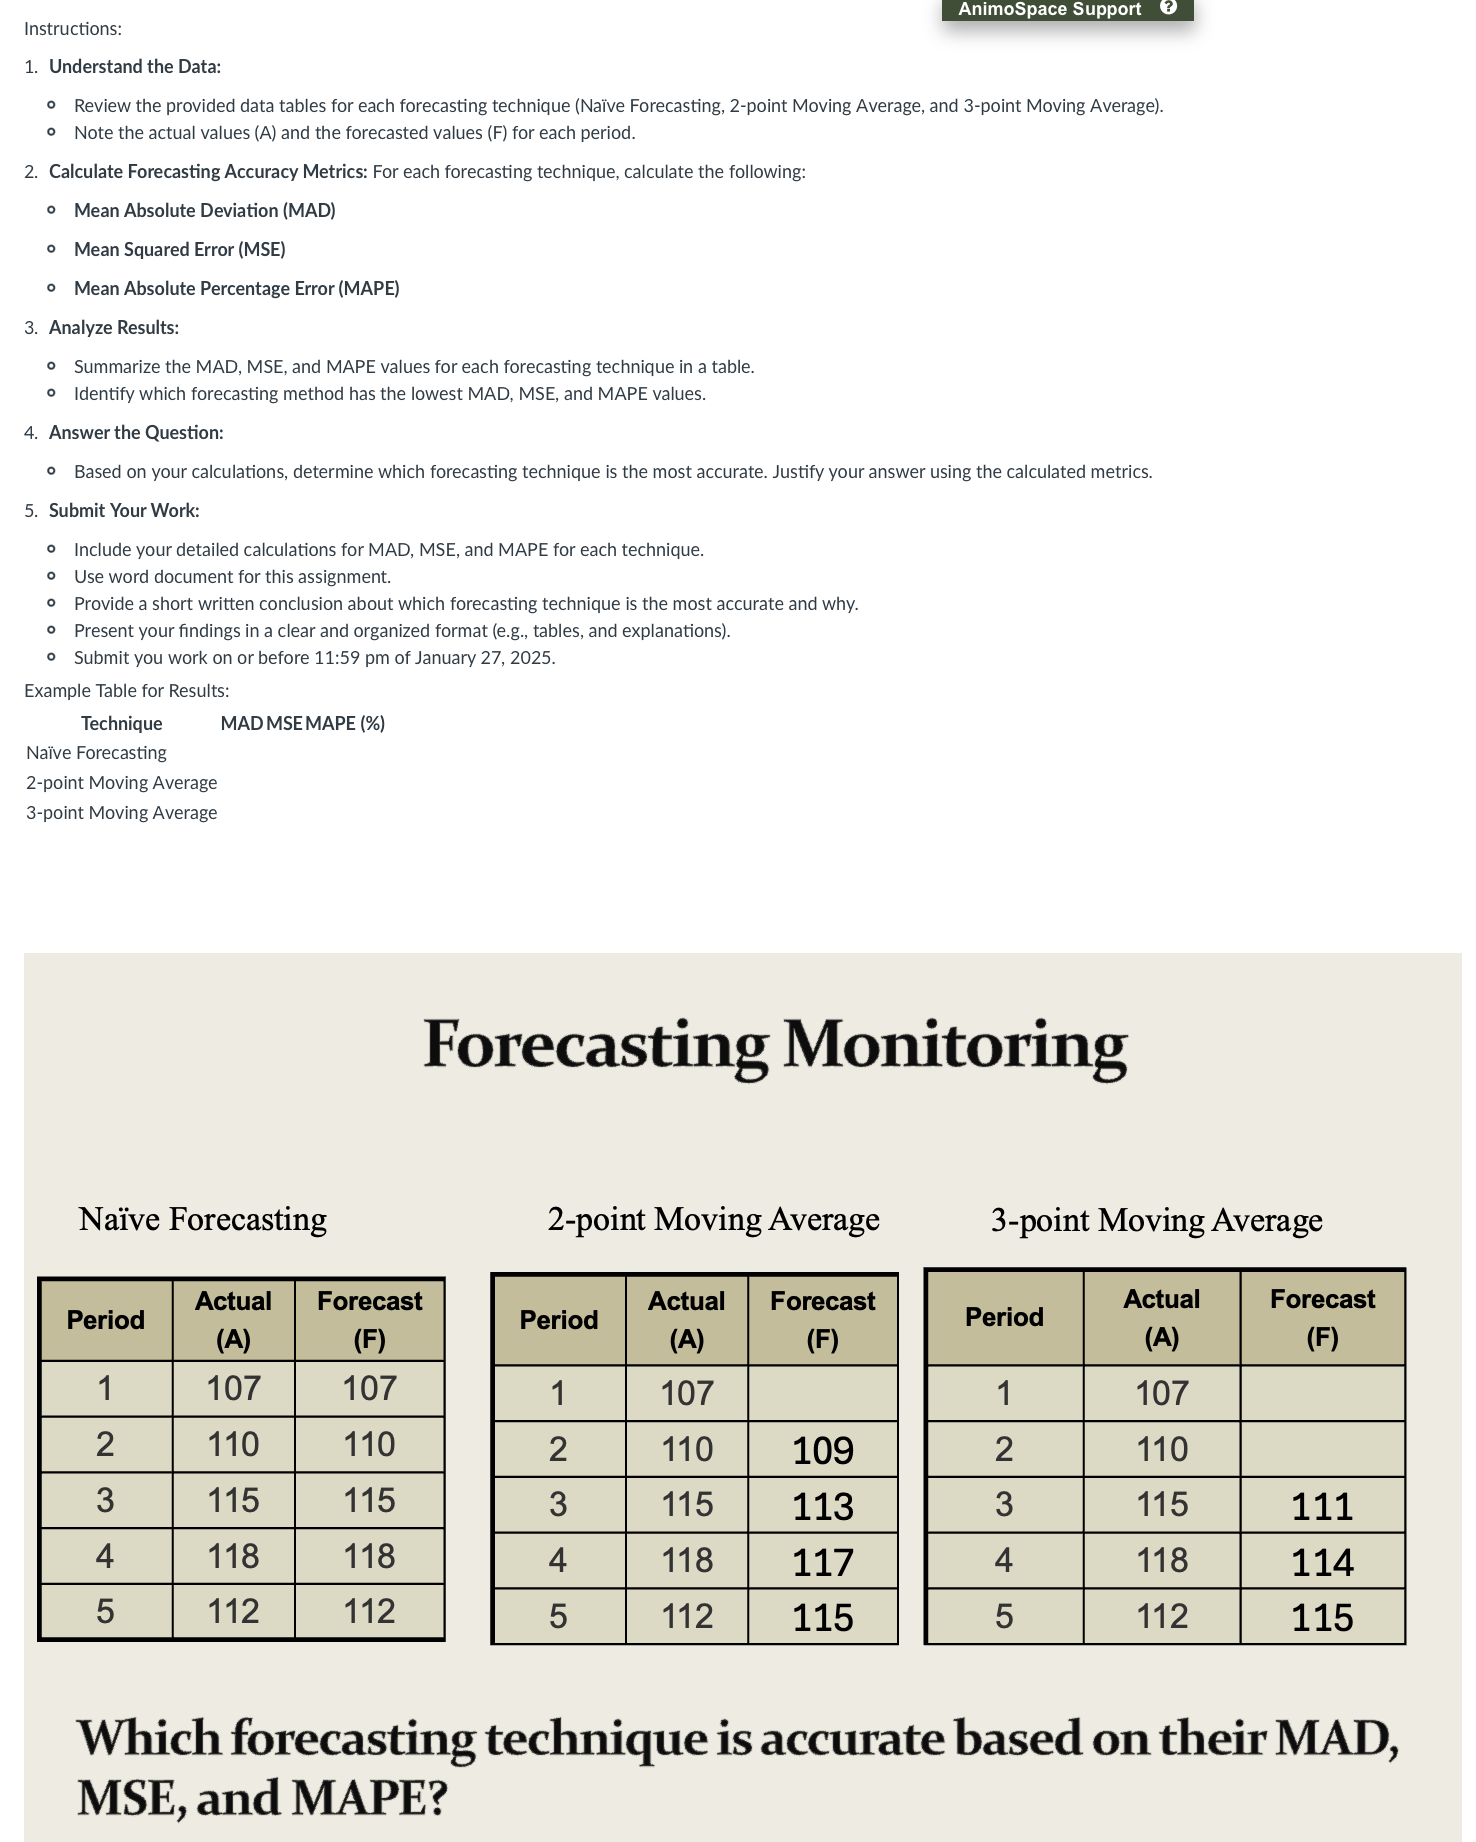
Forecasting Monitoring
Nave Forecasting
point Moving Average
point Moving Average
Which forecasting technique is accurate based on their MAD, MSE, and MAPE?
Step by Step Solution
There are 3 Steps involved in it
1 Expert Approved Answer
Step: 1 Unlock

Question Has Been Solved by an Expert!
Get step-by-step solutions from verified subject matter experts
Step: 2 Unlock
Step: 3 Unlock