Question: Instructions & Answers: Complete a spend analysis for the Freight & Transportation (F&T) and Packaging Materials (PM) categories. (Assignment Total 30 pts) Prep: Data tab
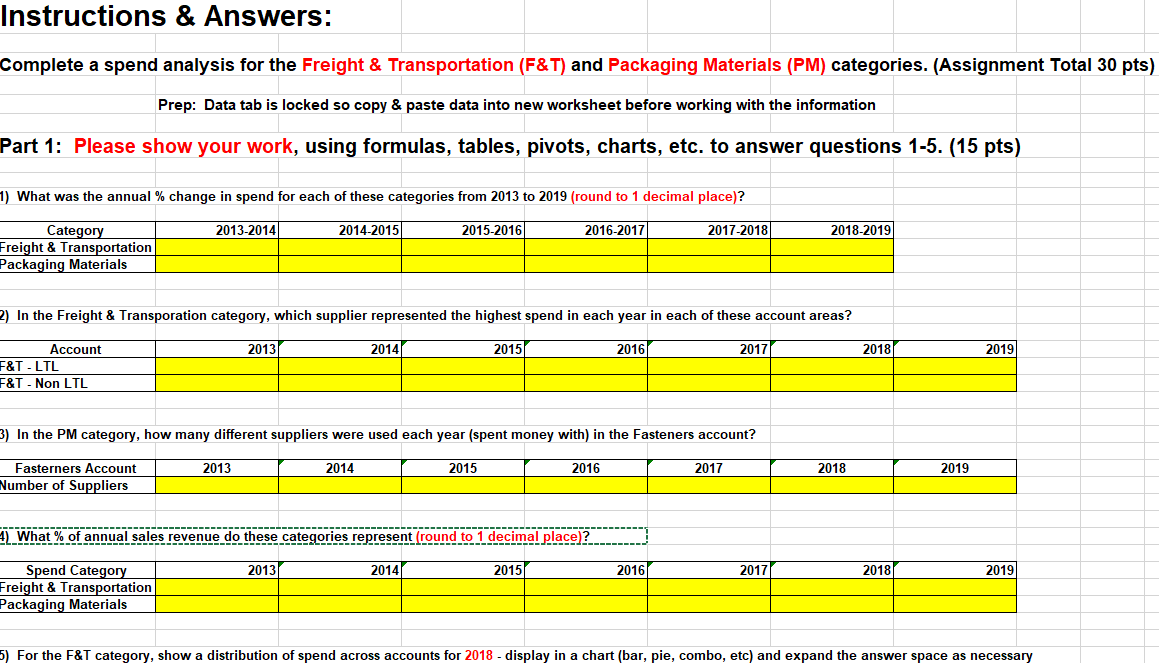
Instructions & Answers: Complete a spend analysis for the Freight & Transportation (F&T) and Packaging Materials (PM) categories. (Assignment Total 30 pts) Prep: Data tab is locked so copy & paste data into new worksheet before working with the information Part 1: Please show your work, using formulas, tables, pivots, charts, etc. to answer questions 1-5. (15 pts) 1) What was the annual % change in spend for each of these categories from 2013 to 2019 (round to 1 decimal place)? 2013-2014 2014-2015 2015-2016 2016-2017 2017-2018 2018-2019) Category Freight & Transportation Packaging Materials 2) In the Freight & Transporation category, which supplier represented the highest spend in each year in each of these account areas? 20131 2014 2015 2016 2017 2018 2019 Account F&T - LTL F&T - Non LTL 3) In the PM category, how many different suppliers were used each year (spent money with) in the Fasteners account? 2013 2014 2015 2016 2017 2018 Fasterners Account Number of Suppliers 2019 4) What % of annual sales revenue do these categories represent (round to 1 decimal place? 2013 2014 2015/ 2016 2017 2018 2019 Spend Category Freight & Transportation Packaging Materials 5) For the F&T category, show a distribution of spend across accounts for 2018 - display in a chart (bar, pie, combo, etc) and expand the answer space as necessary Instructions & Answers: Complete a spend analysis for the Freight & Transportation (F&T) and Packaging Materials (PM) categories. (Assignment Total 30 pts) Prep: Data tab is locked so copy & paste data into new worksheet before working with the information Part 1: Please show your work, using formulas, tables, pivots, charts, etc. to answer questions 1-5. (15 pts) 1) What was the annual % change in spend for each of these categories from 2013 to 2019 (round to 1 decimal place)? 2013-2014 2014-2015 2015-2016 2016-2017 2017-2018 2018-2019) Category Freight & Transportation Packaging Materials 2) In the Freight & Transporation category, which supplier represented the highest spend in each year in each of these account areas? 20131 2014 2015 2016 2017 2018 2019 Account F&T - LTL F&T - Non LTL 3) In the PM category, how many different suppliers were used each year (spent money with) in the Fasteners account? 2013 2014 2015 2016 2017 2018 Fasterners Account Number of Suppliers 2019 4) What % of annual sales revenue do these categories represent (round to 1 decimal place? 2013 2014 2015/ 2016 2017 2018 2019 Spend Category Freight & Transportation Packaging Materials 5) For the F&T category, show a distribution of spend across accounts for 2018 - display in a chart (bar, pie, combo, etc) and expand the answer space as necessary


