Question: Instructions: Calculate the following problems using Excel Pivot Table functionality. Adhere to Excel grading rubric. Resources: Excel YouTube videos. 1. Baltimore Electronics, Ltd. produces microchips.
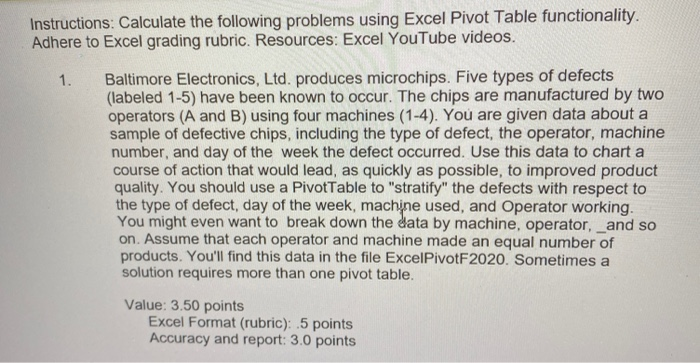
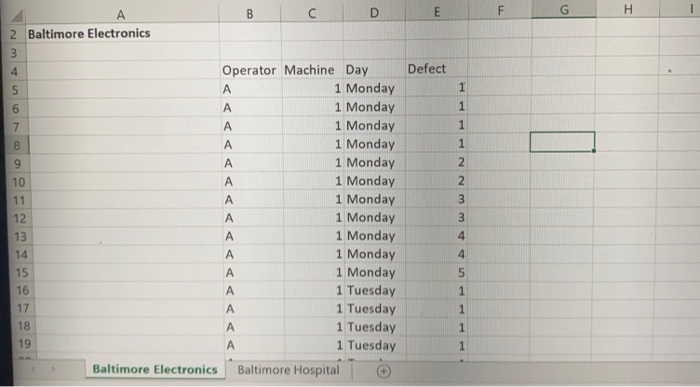
Instructions: Calculate the following problems using Excel Pivot Table functionality. Adhere to Excel grading rubric. Resources: Excel YouTube videos. 1. Baltimore Electronics, Ltd. produces microchips. Five types of defects (labeled 1-5) have been known to occur. The chips are manufactured by two operators (A and B) using four machines (1-4). You are given data about a sample of defective chips, including the type of defect, the operator, machine number, and day of the week the defect occurred. Use this data to chart a course of action that would lead, as quickly as possible, to improved product quality. You should use a PivotTable to "stratify" the defects with respect to the type of defect, day of the week, machine used, and Operator working. You might even want to break down the data by machine, operator, _and so on. Assume that each operator and machine made an equal number of products. You'll find this data in the file ExcelPivotF2020. Sometimes a solution requires more than one pivot table. Value: 3.50 points Excel Format (rubric): .5 points Accuracy and report: 3.0 points E F H WN Defect 1 1 1 1 2 2 B D 2 Baltimore Electronics 3 4 Operator Machine Day 5 1 Monday 6 A 1 Monday 7 A 1 Monday 8 A 1 Monday 9 1 Monday 10 A 1 Monday 11 A 1 Monday 12 A 1 Monday 13 A 1 Monday 14 A 1 Monday 15 A 1 Monday 16 A 1 Tuesday 17 A 1 Tuesday 18 A 1 Tuesday 19 A 1 Tuesday Baltimore Electronics Baltimore Hospital 3 3 4 4 5 1 1 1 1 D6 fix Die E F G H 1 Die A B C D 3 Baltimore Hospital 4 5 Hospital Risk Categ Outcome 6 ER High 7 ER High Die 8 ER High Die 9 ER High Die 10 ER High Die 11 ER High Die 12 ER High Die 13 ER High Die 14 ER High Die 15 ER High Die 16 ER High Die 17 ER High Die 18 ER High Die 19 ER High Die 20 ER High Die Baltimore Electronics Baltimore Hospital Instructions: Calculate the following problems using Excel Pivot Table functionality. Adhere to Excel grading rubric. Resources: Excel YouTube videos. 1. Baltimore Electronics, Ltd. produces microchips. Five types of defects (labeled 1-5) have been known to occur. The chips are manufactured by two operators (A and B) using four machines (1-4). You are given data about a sample of defective chips, including the type of defect, the operator, machine number, and day of the week the defect occurred. Use this data to chart a course of action that would lead, as quickly as possible, to improved product quality. You should use a PivotTable to "stratify" the defects with respect to the type of defect, day of the week, machine used, and Operator working. You might even want to break down the data by machine, operator, _and so on. Assume that each operator and machine made an equal number of products. You'll find this data in the file ExcelPivotF2020. Sometimes a solution requires more than one pivot table. Value: 3.50 points Excel Format (rubric): .5 points Accuracy and report: 3.0 points E F H WN Defect 1 1 1 1 2 2 B D 2 Baltimore Electronics 3 4 Operator Machine Day 5 1 Monday 6 A 1 Monday 7 A 1 Monday 8 A 1 Monday 9 1 Monday 10 A 1 Monday 11 A 1 Monday 12 A 1 Monday 13 A 1 Monday 14 A 1 Monday 15 A 1 Monday 16 A 1 Tuesday 17 A 1 Tuesday 18 A 1 Tuesday 19 A 1 Tuesday Baltimore Electronics Baltimore Hospital 3 3 4 4 5 1 1 1 1 D6 fix Die E F G H 1 Die A B C D 3 Baltimore Hospital 4 5 Hospital Risk Categ Outcome 6 ER High 7 ER High Die 8 ER High Die 9 ER High Die 10 ER High Die 11 ER High Die 12 ER High Die 13 ER High Die 14 ER High Die 15 ER High Die 16 ER High Die 17 ER High Die 18 ER High Die 19 ER High Die 20 ER High Die Baltimore Electronics Baltimore Hospital