

Question: Instructions Code the solutions in a Jupyter Notebook in the same order of the problems presented below. Be sure to run each cell to display
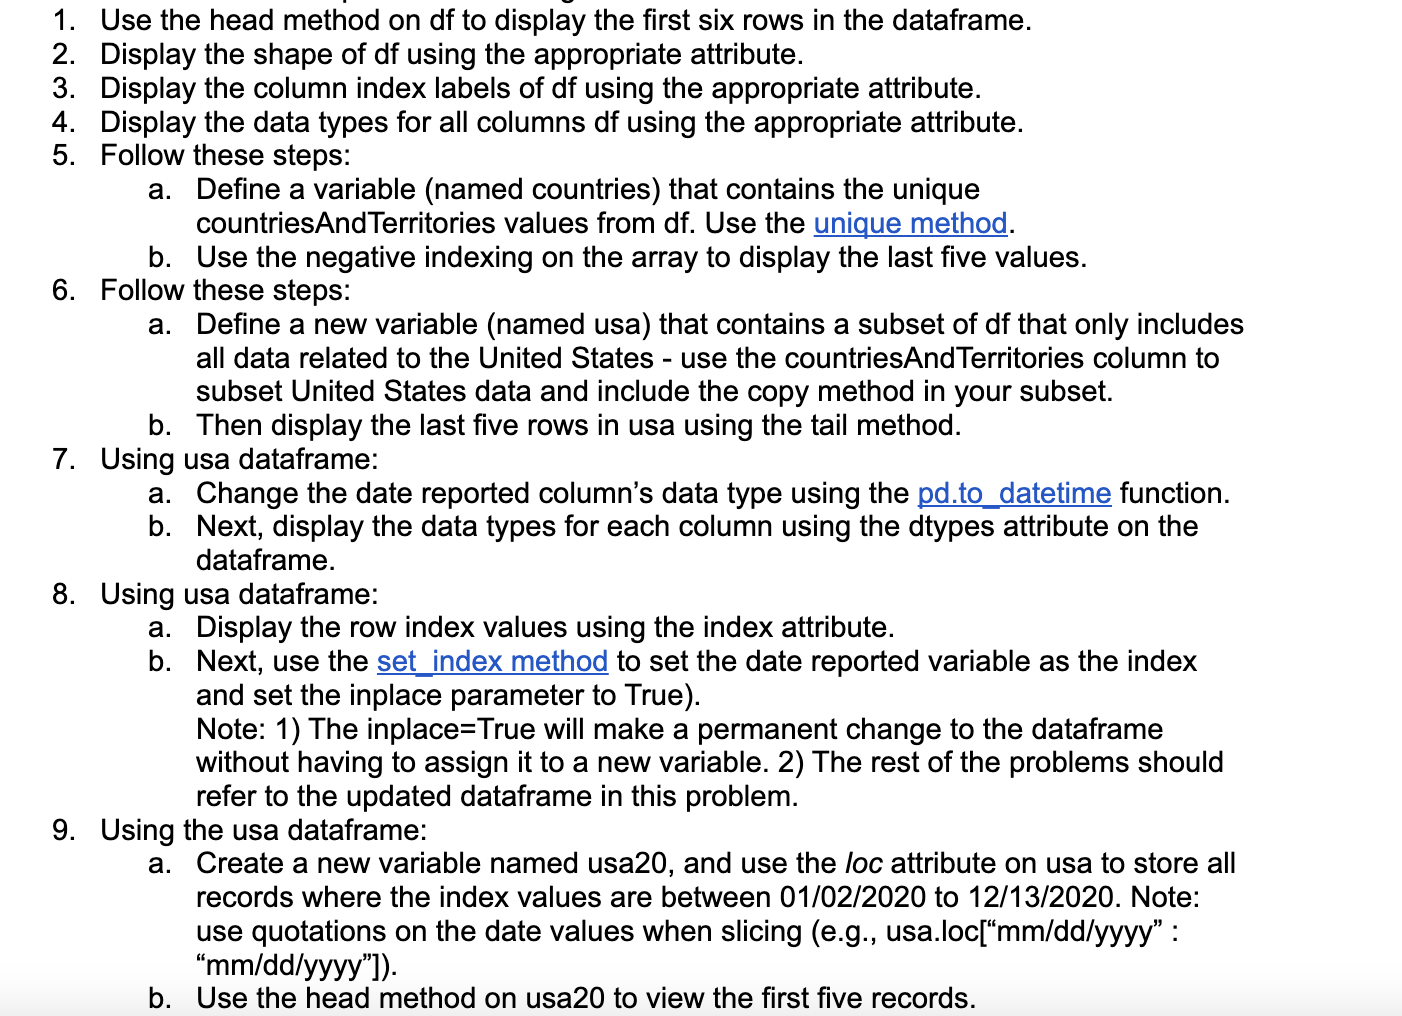
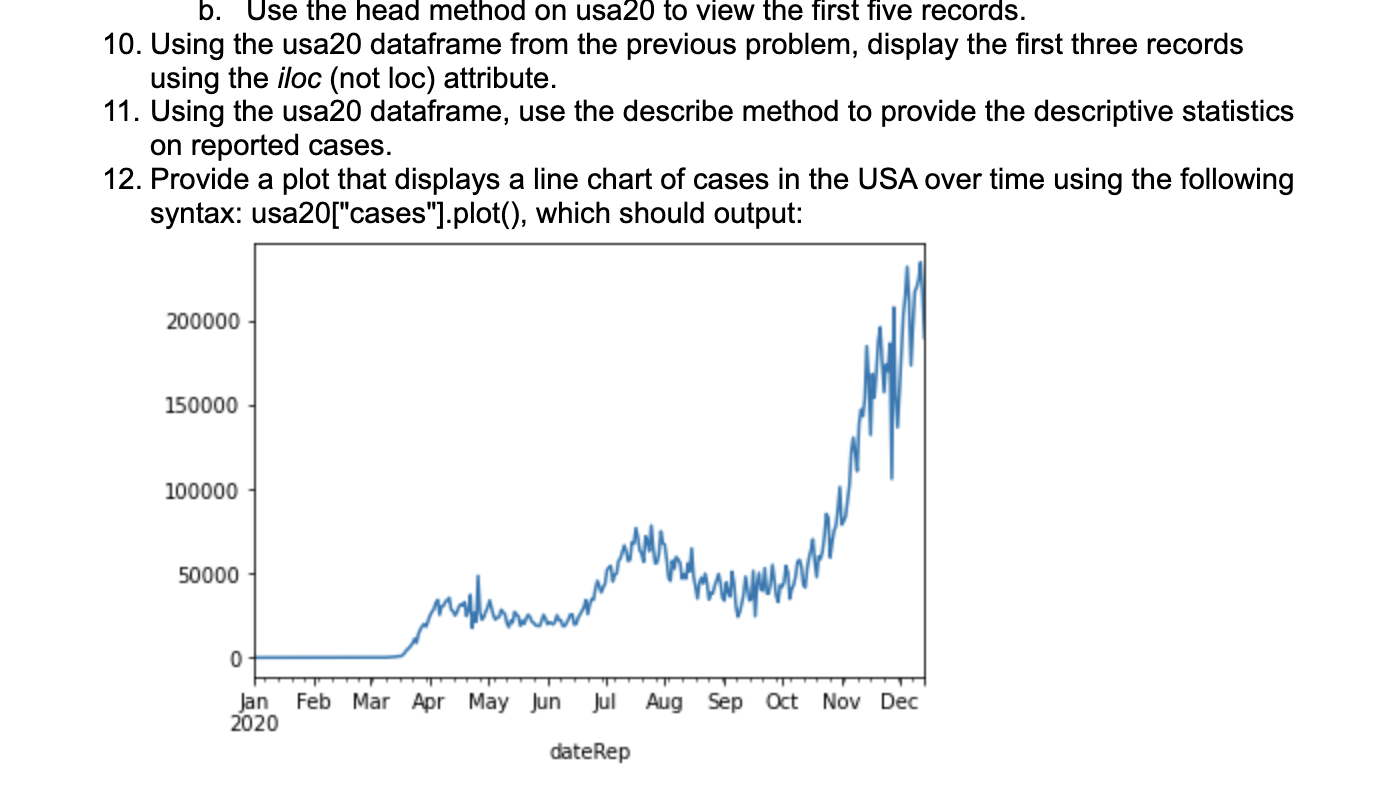
Instructions Code the solutions in a Jupyter Notebook in the same order of the problems presented below. Be sure to run each cell to display the end result. Save your work as a Jupyter file (.ipynb) and as a PDF file. Upload both files to Blackboard using one submission. The assignment below uses a covid19.csv data file from the European Centre for Disease Prevention and Control. Use the data file provided on Blackboard to complete this assignment. About the Data The data variables in the dataset are: - dateRep = date of reported cases and deaths - day, month, year = day, month, and year of each reported case and death - cases = the number of reported cases on a given date (dateRep) - deaths = the number of reported deaths on a given date (dateRep) - countriesAndTerritories = country and territories that report their COVID19 cases and deaths - geolD = abbreviation for each countriesAndTerritories - popData2019 = population as per country as of 2019 - continentExp = associated continent for each location Note: not all of the variables will be referenced in this assignment. Note: Not all variables above will be used in this assignment. Use one code cell per problem in Jupyter. Problems: 0 . The first code cell in Jupyter Notebook will contain the import statement for pandas, followed by the pd.read_csv() function that loads the covid19.csv file. Include the entire filepath that shows where your data file is located on your computer. Assign the data to a variable named df. Use the dataframe to complete the followinq: 1. Use the head method on df to display the first six rows in the dataframe. 2. Display the shape of df using the appropriate attribute. 3. Display the column index labels of df using the appropriate attribute. 4. Display the data types for all columns df using the appropriate attribute. 5. Follow these steps: a. Define a variable (named countries) that contains the unique countriesAndTerritories values from df. Use the unique method. b. Use the negative indexing on the array to display the last five values. 6. Follow these steps: a. Define a new variable (named usa) that contains a subset of df that only includes all data related to the United States - use the countriesAndTerritories column to subset United States data and include the copy method in your subset. b. Then display the last five rows in usa using the tail method. 7. Using usa dataframe: a. Change the date reported column's data type using the pd.to datetime function. b. Next, display the data types for each column using the dtypes attribute on the dataframe. 8. Using usa dataframe: a. Display the row index values using the index attribute. b. Next, use the set index method to set the date reported variable as the index and set the inplace parameter to True). Note: 1) The inplace=True will make a permanent change to the dataframe without having to assign it to a new variable. 2) The rest of the problems should refer to the updated dataframe in this problem. 9. Using the usa dataframe: a. Create a new variable named usa20, and use the loc attribute on usa to store all records where the index values are between 01/02/2020 to 12/13/2020. Note: use quotations on the date values when slicing (e.g., usa.loc[" mm/dd/yyyy " : "mm/dd/yyyy"]). b. Use the head method on usa20 to view the first five records. b. Use the head method on usa20 to view the first five records. 10. Using the usa20 dataframe from the previous problem, display the first three records using the iloc (not loc) attribute. 11. Using the usa20 dataframe, use the describe method to provide the descriptive statistics on reported cases. 12. Provide a plot that displays a line chart of cases in the USA over time using the following syntax: usa20["cases"].plot(), which should output
Step by Step Solution
There are 3 Steps involved in it

Get step-by-step solutions from verified subject matter experts