

Question: Instructions Continue in the same Excel workbook prepared in Module 4: Week 4, adding the following tabs: The 12 th tab in your Financial Statement
Instructions
Continue in the same Excel workbook prepared in Module 4: Week 4, adding the following tabs:
- The 12th tab in your Financial Statement Analysis Template must be labeled Common Sized Balance Sheets.
- Set-up like the Historical Balance Sheets (Tab 3), this worksheet should use formulas to calculate the common sized percentages, linking to the Historical Balance Sheets for the calculations. Total Assets should be used as the base for all common sized calculations on the Balance Sheets. Common sized percentages should be calculated for all three historical years presented.
- See Exhibit A for a partial example of this tab.
- The 13th tab in your Financial Statement Analysis Template must be labeled Common Sized Income Statements.
- Set-up like the Historical Income Statements (Tab 2), this worksheet should use formulas to calculate the common sized percentages, linking to the Historical Income Statements for the calculations. Revenue or Total Revenue (depending on your company) should be used as the base for all common sized calculations on the Income Statements. Common sized percentages should be calculated for all three historical years presented.
- The 14th tab in your Financial Statement Analysis Template must be labeled Horizontal Analysis of Balance Sheets.
- Start by copying and pasting the Historical Balance Sheets from Tab 3 to this worksheet. Then, add dollar and percentage change columns between each of the set of historical years.
- See Exhibit B for an example of this tab.
- The 15th tab in your Financial Statement Analysis Template must be labeled Horizontal Analysis of Income Statements.
- Start by copying and pasting the Historical Income Statements from Tab 2 to this worksheet. Then, add dollar and percentage change columns between each of the set of historical years.
- The 16th tab in your Financial Statement Analysis Template must be labeled Projected Income Statements. Three years of projected statements should be included, starting with the most recent year after the companys last issued report.
- The 17th tab in your Financial Statement Analysis Template must be labeled Projected Balance Sheets. Three years of projected statements should be included. Three years of projected statements should be included, starting with the most recent year after the companys last issued report.
- The 18th tab in your Financial Statement Analysis Template must be labeled Projected Statement of Cash Flows. Three years of projected statements should be included, starting with the most recent year after the companys last issued report.
- Other information relating to projected tabs:
- Projections should be based on research performed on your company and its industry. Use historical, trend, ratio data and current and future economic projections as well as information from the companys MD&A to aid in preparing projections.
- Clearly state your assumptions in a text box at the bottom of each tab. Cite sources for assumptions based on research.
- The statements should be consistent, reasonable, and accurate. Areas that will be checked for accuracy include:
- The Balance Sheets should balance for all years presented.
- Retained earnings should be properly calculated using the prior years balance, net income, and dividends.
- The Ending Cash Balance on the Statement of Cash Flows should agree to the Cash Balance shown on the Balance Sheet for the same year.
- Net Income on the Income Statements should match what is reported on the top of the Statement of Cash Flows (if indirect method is used).
- Other instructions:
- The Excel workbook should be professionally formatted. Professional formatting includes:
- All numbers are formatted similarly. The use of decimals, commas for thousands, and other formatting is consistent.
- Dollar signs are included in the first and last numbers of each column.
- Subtotals and totals are preceded by a single underline. Totals are followed by a double underline.
- Line descriptions are indented/bolded in a manner that makes the spreadsheet easy to read.
- All common sized, horizontal analysis, and projection items should be calculated using formulas. Totals and subtotals should also be calculated using formulas. For an example of which cells may need formulas, please see Exhibits A & B.
- The Excel workbook should be professionally formatted. Professional formatting includes:
- Other information relating to projected tabs:
Please help with the last three tabs and explain how you got your information. I have attached everything I have so far. Thank you.
I need help with tabs 16, 17, and 18 of this assignment which asks for future projections of the company. The company I'm working with is FedEx Corporation and I have attached the information I have on the last three years along with other information that was required for the project in case it's needed. I need projections for the next three years for each tab and I am having trouble with finding them. The last three images with no financial information are the ones where the projections would go. Please help and explain how you got your projections.
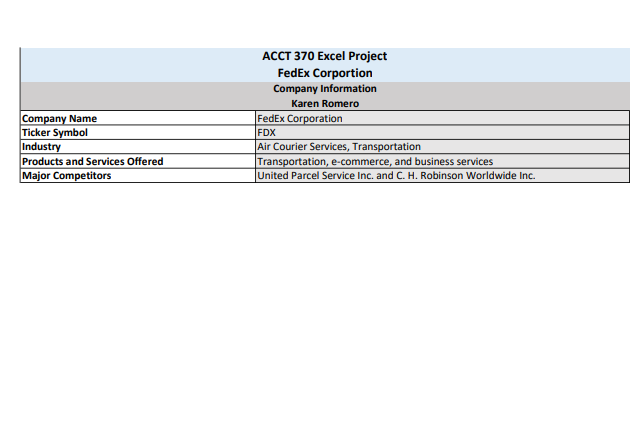
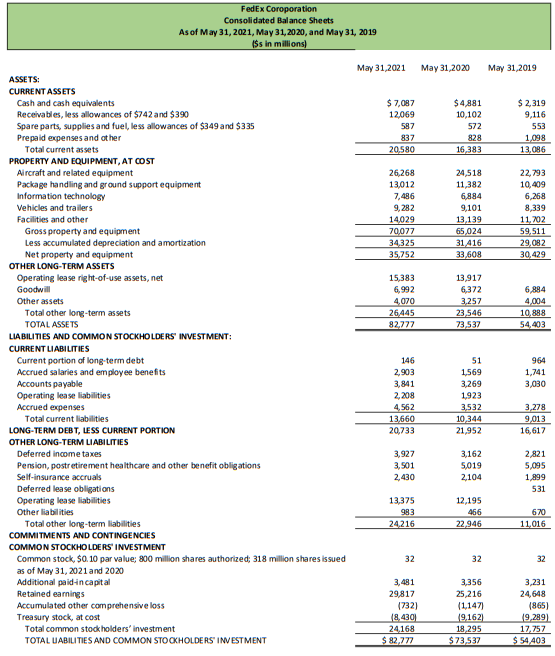
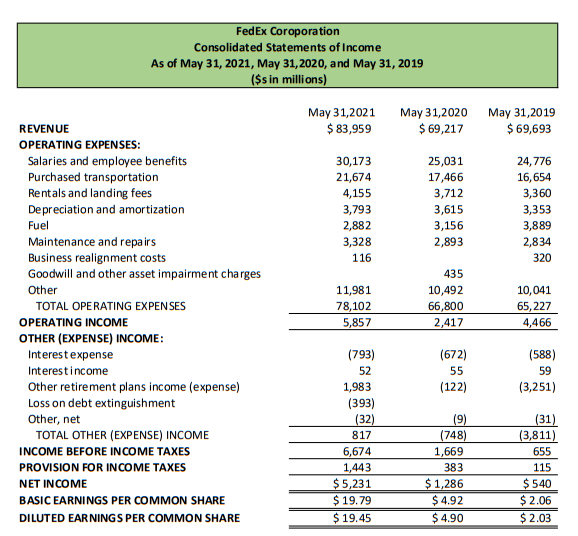
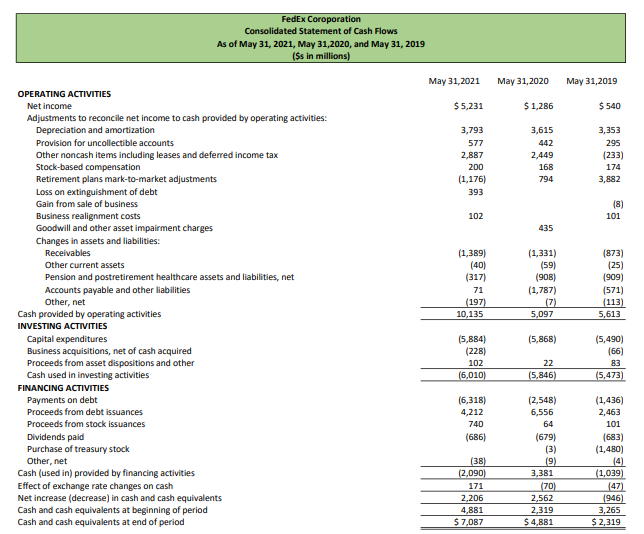
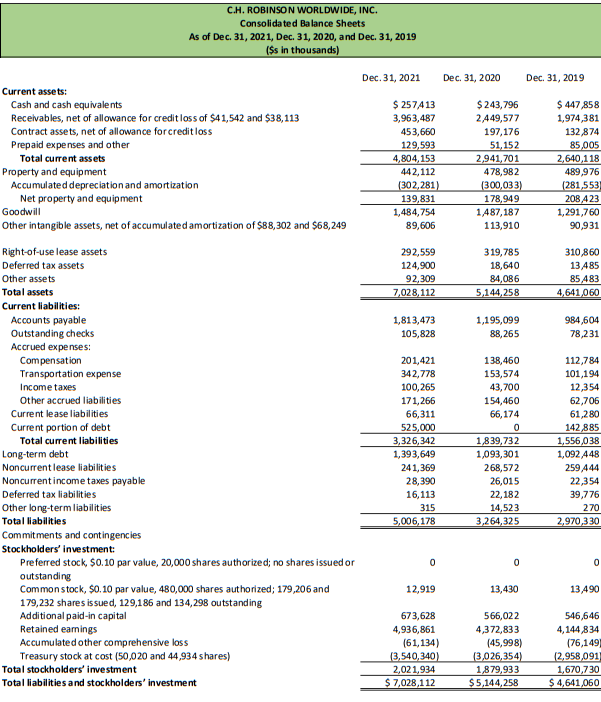
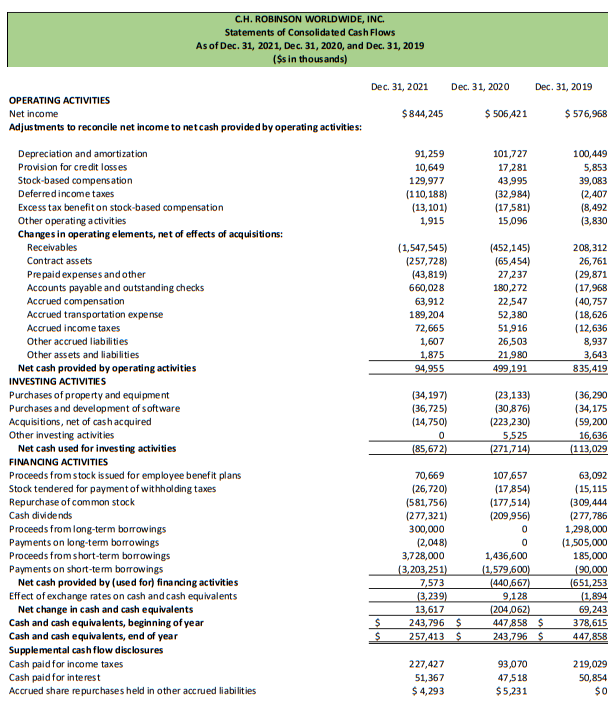
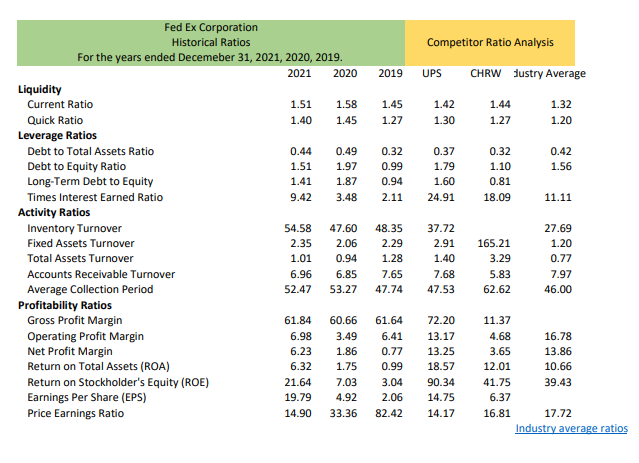
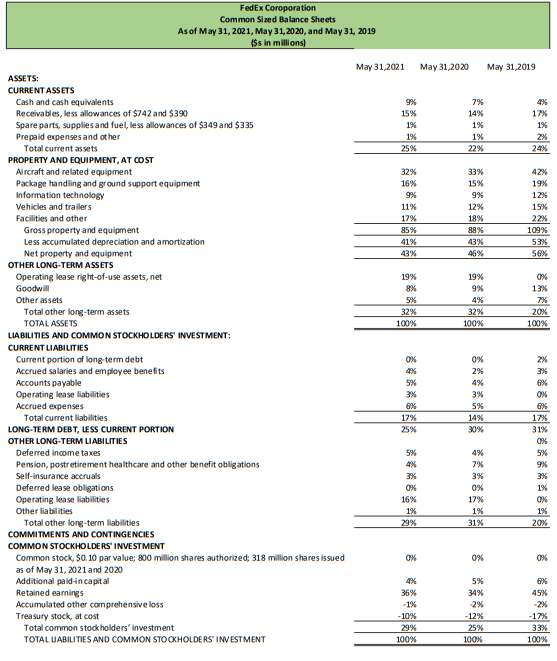
Company Name Ticker Symbol Industry Products and Services Offered Major Competitors ACCT 370 Excel Project FedEx Corportion Company Information Karen Romero FedEx Corporation FDX Air Courier Services, Transportation Transportation, e-commerce, and business services United Parcel Service Inc. and C. H. Robinson Worldwide Inc. FedEx Coroporation Consolidated Balance Sheets As of May 31, 2021, May 31, 2020, and May 31, 2019 Iss in millions) May 31,2021 May 31,2020 May 31, 2019 $ 7,087 12,069 587 837 20,580 $4881 10,102 572 828 16,383 $ 2,319 9,116 553 1,098 13,086 26.268 13,012 7,486 9,282 14,029 24,518 11,382 6,884 9,101 13.139 65 31 416 33,608 22,793 10,409 6,268 8,339 11,702 59,511 29.082 30,429 34325 35,752 15,383 6,992 4,070 26,445 82,777 13,917 6,372 3.257 23,546 73,537 6,894 4004 10.888 54,403 ASSETS: CURRENT ASSETS Cash and cash equivalents Receivables, less allowances of $742 and $390 Spare parts, supplies and fuel, less allowances of $349 and $335 Prepaid expenses and other Total current assets PROPERTY AND EQUIPMENT, AT COST Aircraft and related equipment Package handling and ground support equipment Information technology Vehicles and trailers Facilities and other Gross property and equipment Less accumulated depreciation and amortization Net property and equipment OTHER LONG-TERM ASSETS Operating lease right-of-use assets, net Goodwill Other assets Total other long-term assets TOTAL ASSETS LIABILITIES AND COMMON STOCKHOLDERS INVESTMENT: CURRENT LIABILITIES Current portion of long-term debt Accrued salaries and employee benefits Accounts payable Operating lease liabilities Accrued expenses Total current liabilities LONG-TERM DEBT, LESS CURRENT PORTION OTHER LONG-TERM LIABILITIES Deferred income taxes Pension, postretirement healthcare and other benefit obligations Self-insurance accruals Deferred lease obligations Operating lease liabilities Other liabilities Total other long-term liabilities COMMITMENTS AND CONTINGENCIES COMMON STOCKHOLDERS INVESTMENT Common stock, $0.10 par value; 800 million shares authorized: 318 million shares issued as of May 31, 2021 and 2020 Additional paid in capital Retained earnings Accumulated other comprehensive loss Treasury stock, at cost Total common stockholders' investment TOTAL LABILITIES AND COMMON STOCKHOLDERS' INVESTMENT 964 1,741 3,030 146 2,903 3,841 2,208 4,562 13,660 20,733 51 1.569 3,269 1,923 3,532 10,344 21,952 3,278 9013 16,617 3.927 3.501 2,430 3.162 5,019 2,104 2821 5,095 1,899 531 13,375 993 12,195 466 22.946 670 11.016 24216 32 32 32 3,481 29,817 (732) 18.4301 24168 $ 82,777 3.356 25,216 (1.147) 9.162 18 295 $ 73,537 3,231 24,648 (865) 9,289) 17,757 $ 54,403 May 31,2019 $ 69,693 24,776 16,654 3,360 3,353 3,889 2,834 320 FedEx Coroporation Consolidated Statements of Income As of May 31, 2021, May 31,2020, and May 31, 2019 ($sin millions) May 31,2021 May 31,2020 REVENUE $ 83,959 $ 69,217 OPERATING EXPENSES: Salaries and employee benefits 30,173 25,031 Purchased transportation 21,674 17,466 Rentals and landing fees 4,155 3,712 Depreciation and amortization 3,793 3,615 Fuel 2,882 3,156 Maintenance and repairs 3,328 2,893 Business realignment costs 116 Goodwill and other asset impairment charges 435 Other 11,981 10,492 TOTAL OPERATING EXPENSES 78,102 66,800 OPERATING INCOME 5,857 2,417 OTHER (EXPENSE) INCOME: Interest expense (793) (672) Interest income 52 55 Other retirement plans income (expense) 1,983 (122) Loss on debt extinguishment (393) Other, net (32) (9) TOTAL OTHER (EXPENSE) INCOME 817 (748) INCOME BEFORE INCOME TAXES 6,674 1,669 PROVISION FOR INCOME TAXES 1,443 383 NET INCOME $5,231 $1,286 BASIC EARNINGS PER COMMON SHARE $19.79 $4.92 DILUTED EARNINGS PER COMMON SHARE $ 19.45 $ 4.90 10, 041 65,227 4,466 (588) 59 (3,251) (31) (3,811) 655 115 $ 540 $ 2.06 $ 2.03 FedEx Coroporation Consolidated Statement of Cash Flows As of May 31, 2021, May 31,2020, and May 31, 2019 ($s in millions) May 31,2021 May 31,2020 May 31, 2019 $ 5,231 $1,286 $ 540 3,793 577 2,887 200 (1,176) 393 3,615 442 2,449 168 794 3,353 295 (233) 174 3,882 (8) 101 102 435 OPERATING ACTIVITIES Net income Adjustments to reconcile net income to cash provided by operating activities: Depreciation and amortization Provision for uncollectible accounts Other noncash items including leases and deferred income tax Stock-based compensation Retirement plans mark-to-market adjustments Loss on extinguishment of debt Gain from sale of business Business realignment costs Goodwill and other asset impairment charges Changes in assets and liabilities: Receivables Other current assets Pension and postretirement healthcare assets and liabilities, net Accounts payable and other liabilities Other, net Cash provided by operating activities INVESTING ACTIVITIES Capital expenditures Business acquisitions, net of cash acquired Proceeds from asset dispositions and other Cash used in investing activities FINANCING ACTIVITIES Payments on debt Proceeds from debt issuances Proceeds from stock issuances Dividends paid Purchase of treasury stock Other, net Cash (used in provided by financing activities Effect of exchange rate changes on cash Net increase (decrease) in cash and cash equivalents Cash and cash equivalents at beginning of period Cash and cash equivalents at end of period (1,389) (40) (317) 71 (197) 10,135 (1,331) (59) (908) (1,787) (7) 5,097 (873) (25) (909) (571) (113) 5,613 (5,868) (5,884) (228) 102 (6,010) (5,490) (66) 83 (5,473) 22 (5,846) (6,318) 4,212 740 (686) (38) (2,090) 171 2,206 4,881 $ 7,087 (2.548) 6,556 64 (679) (3) (9) 3,381 (70) 2.562 2,319 $ 4,881 (1,436) 2,463 101 (683) (1,480) (4) (1,039) (47) (946) 3,265 $ 2,319 United Parcel Service, Inc. Consolidated Statements of Income As of Dec. 31, 2021, Dec. 31, 2020, and Dec. 31, 2019 ($s in millions, except per share amounts) Dec. 31, 2021 Dec. 31, 2020 Dec 31, 2019 $ 97,287 $ 84,628 $ 74,094 Revenue Operating Expenses: Compensation and benefits Repairs and maintenance Depreciation and amortization Purchased transportation Fuel Other occupancy Other expenses Total Operating Expenses Operating Profit Other Income and (Expense): Investment income (expense) and other Interest expense Total Other Income and (Expense) Income Before Income Taxes Income Tax Expense Net Income Basic Earnings Per Share (in dollars per share) Diluted Earnings Per Share (in dollars per share) 46,707 2,443 2,953 19,058 3,847 1,698 7,771 84,477 12,810 44,529 2,365 2,698 15,631 2,582 1,539 7,600 76,944 7,684 38,908 1,838 2,360 12,590 3,289 1,392 5,919 66,296 7,798 4,479 (694) 3,785 16,595 3,705 $ 12,890 $ 14.75 $ 14.68 (5,139) (701) (5,840) 1,844 501 $ 1,343 $ 1.55 $ 1.54 (1,493) (653) (2,146) 5,652 1,212 $ 4,440 $ 5.14 $ 5.11 United Parcel Service, Inc. Consolidated Balance Sheets As of Dec. 31, 2021, Dec. 31, 2020, and Dec 31, 2019 ($s in millions) Dec. 31, 2021 Dec 31, 2020 Dec 31, 2019 $ 10,225 338 12,669 0 1,800 24,934 33,475 3,562 3,692 2,486 26 176 1,054 69,405 $ 5,910 406 10,750 1,197 1,953 20,216 32,254 3,073 3,367 2,274 25 527 672 62,408 $5,238 503 9,552 0 1,810 17,103 30,482 2,856 3,813 2,167 24 330 1,082 57,857 Current Assets: Cash and cash equivalents Marketable securities Accounts receivable, less allowances Assets held for sale Other current assets Total Current Assets Property, Plant and Equipment, Net Operating Lease, Right-of-Use Asset Goodwill Intangible Assets, Net Investments and Restricted Cash Deferred Income Tax Assets Other Non-Current Assets Total Assets Current Liabilities: Current maturities of long-term debt, commercial paper and finance leases Current maturities of operating leases Accounts payable Accrued wages and withholdings Self-insurance reserves Accrued group welfare and retirement plan contributions Liabilities to be disposed of Other current liabilities Total Current Liabilities Long-Term Debt and Finance Leases Non-current Operating Leases Pension and Postretirement Benefit Obligations Deferred Income Tax Liabilities Other Non-Current Liabilities Shareowners' Equity: Class A Commonstock Class B Common stock Additional paid-in capital Retained eamings Accumulated other comprehensive loss Deferred compensation obligations Less: Treasury stock (0.3 shares in 2021 and 0.4 shares in 2020 and 2019) Total Equity for Controlling Interests Noncontrolling Interests Total Shareowners' Equity Total Liabilities and Share owners' Equity 2,131 580 7,523 3,819 1,048 1,038 0 1,430 17,569 19,784 3,033 2,623 560 6,455 3,569 1,085 927 347 1,450 17,016 22,031 2,540 15,817 488 3,847 3,420 538 5,555 2,552 914 793 0 1,641 15,413 21,818 2,391 10,601 1,632 2,719 8,047 3,125 3,578 $ 2 $ 7 1,343 16,179 (3,278) 16 (16) $ 14,253 16 14,269 69,405 $ 2 $ 7 865 6,896 (7,113) 20 (20) $ 657 12 669 62,408 $ $2 $ 7 150 9,105 (5,997) 26 (26) $3,267 16 3,283 57,857 $ $ United Parcel Service, Inc. Statements of Consolidated Cash Flows As of Dec. 31, 2021, Dec. 31, 2020, and Dec. 31, 2019 ($s in millions) Dec. 31, 2021 Dec. 31, 2020 Dec. 31, 2019 $ 12,890 $ 1,343 $ 4,440 2,953 (2456) (576) 178 1,645 878 137 2,698 7,125 (3.125) 503 (8581 796 917 2,360 3,141 12,362 (185 100 915 74 (2,147) 312 1,265 (245) 151 22 15,007 (1,562) 218 904 1,631 (110) (21) 10.459 (717 698 419 (446 182 20 8,639 (4,194) Cash Flows From Operating Activities: Net Income Adjustments to reconcile net income to net cash from operating activities: Depreciation and amortization Pension and postretirement benefit expense Pension and postretirement benefit contributions Self-insurance reserves Deferred tax benefit) expense Stock compensation expense Other (gains) losses Changes in assets and liabilities, net of effect of acquisitions: Accounts receivable Other assets Accounts payable Accrued wages and with holdings Other liabilities Other operating activities Net cash from operating activities Cash Flows From Investing Activities: Capital expenditures Proceeds from disposals of property, plant and equipment Purchases of marketable securities Sales and maturities of marketable securities Net change in finance receivables Cash paid for business acquisitions, net of cash and cash equivalents acquired Other investing activities Net cash (used in) investing activities Cash Flows From Financing Activities: Net change in short-term debt Proceeds from long-term borrowings Repayments of long-term borrowings Purchases of common stock Issuances of common stock Dividends Other financing activities Net cash (used in) financing activities Effect Of Exchange Rate Changes On Cash, Cash Equivalents and Restricted Cash Net Increase (Decrease) In Cash, Cash Equivalents and Restricted Cash Cash And Cash Equivalents: Beginning of period End of period 872 15,412] 40 (254) 360 44 (20) (41) 15,283) (6,380 65 (561 883 13 (312) 366 34 (602) 18 (3,818) 75 16,061 0 0 12,773) (500) 251 (3,437) (1364) 16,823) (21) 4,345 (2,4621 5,003 (3,3921 (224) 285 (3,374) (353) 14.5171 13 672 310 5.203 (3,096 (1,004 213 (3.194 (166 1.727 20 871 5,910 $ 10,255 5,238 $5.910 4,367 $ 5238 C.H. ROBINSON WORLDWIDE, INC. Consolidated Statements of Income As of Dec. 31, 2021, Dec. 31, 2020, and Dec. 31, 2019 ($s in thousands except per share) Dec. 31, 2021 Dec 31, 2020 Dec 31, 2019 22046574 1,055,564 $ 23,102,138 15147562 1,059,544 $ 16,207,106 14322295 987,213 $ 15,309,508 Revenues: Transportation Sourcing Total revenues Costs and expenses: Purchased transportation and related services Purchased products sourced for resale Personnel expenses Other selling, general, and administrative expenses Total costs and expenses Income from operations Interest and other expenses Income before provision for income taxes Provision for income taxes Net income Other comprehensive (Loss) income Comprehensive income Basic net income per share in dollars per share) Diluted net income per share (in dollars per share) Basic weighted average shares outstanding (in shares) 18,994,574 $955,475 1,543,610 526,371 22,020,030 1,082,108 (59,817) 1,022,291 178,046 844,245 (15,136) $ 829,109 $6.37 $ 6.31 132,482 12,834,608 $960,241 1,242,867 496,122 15,533,838 673,268 (44,937) 628,331 121,910 506,421 30,151 $ 536,572 $ 3.74 $ 3.72 135,532 11,839,433 $ 883,765 1,298,528 497,806 14,519,532 789,976 (47,719) 742,257 165,289 576,968 (4,214) $ 572,754 $ 4.21 $4.19 136,955 Dilutive effect of outstanding stock awards (in shares) 1,352 641 780 Diluted weighted average shares outstanding (in shares) 133,834 136,173 137,735 C.H. ROBINSON WORLDWIDE, INC. Consolidated Balance Sheets As of Dec. 31, 2021, Dec. 31, 2020, and Dec. 31, 2019 ($s in thousands) Dec. 31, 2021 Dec. 31, 2020 Dec 31, 2019 $ 257413 3,963,487 453,660 129,593 4,804,153 442,112 (302,281) 139,831 1,484,754 89,606 $ 243,796 2,449,577 197,176 51, 152 2,941,701 478,982 (300,033) 178,949 1,487,187 113,910 $ 447,858 1,974,381 132,874 85,005 2,640, 118 489,976 (281,553 208 423 1,291,760 90,931 292,559 124,900 92,309 7,028,112 319,785 18,640 84,086 5,144,258 310,860 13,485 85,483 4,641,060 1,813,473 105,828 1,195,099 88,265 984,604 78,231 Current assets: Cash and cash equivalents Receivables, net of allowance for credit loss of $41,542 and $38,113 Contract assets, net of allowance for credit loss Prepaid expenses and other Total current assets Property and equipment Accumulated depreciation and amortization Net property and equipment Goodwill Other intangible assets, net of accumulated amortization of $88,302 and $68,249 Right-of-use lease assets Deferred tax assets Other assets Total assets Current liabilities: Accounts payable Outstanding checks Accrued expenses: Compensation Transportation expense Income taxes Other accrued liabilities Current lease liabilities Current portion of debt Total current liabilities Long-term debt Noncurrent lease liabilities Noncurrent income taxes payable Deferred tax liabilities Other long-term liabilities Total liabilities Commitments and contingencies Stockholders' investment: Preferred stock, $0.10 par value, 20,000 shares authorized; no shares issued or outstanding Common stock, $0,10 par value, 480,000 shares authorized; 179,206 and 179,232 shares issued, 129,186 and 134,298 outstanding Additional paid-in capital Retained eamings Accumulated other comprehensive loss Treasury stock at cost (50,020 and 44,934 shares) Total stockholders' investment Total liabilities and stockholders' investment 201,421 342,778 100,265 171,266 66,311 525,000 3,326,342 1,393,649 241,369 28,390 16,113 315 5,006,178 138,460 153,574 43,700 154,460 66,174 0 1,839,732 1,093,301 268,572 26,015 22,182 14,523 3,264,325 112,784 101,194 12,354 62,706 61,280 142,885 1,556,038 1,092 448 259 444 22,354 39,776 270 2,970,330 0 0 0 12,919 13,430 13,490 673,628 4,936,861 (61, 134) (3,540, 340) 2,021,934 $ 7,028,112 566,022 4,372,833 (45,998) (3,026,354) 1,879,933 $5,144,258 546,646 4,144,834 (76,149 (2,958,091 1,670,730 $ 4,641,060 C.H. ROBINSON WORLDWIDE, INC. Statements of Consolidated Cash Flows As of Dec. 31, 2021, Dec. 31, 2020, and Dec 31, 2019 ($sin thousands) Dec 31, 2021 Dec. 31, 2020 Dec. 31, 2019 $844,245 $ 506 421 $ 576,968 91,259 10,649 129,977 (110,188) (13,101) 1,915 101,727 17,281 43,995 (32,984) (17,581) 15,096 100,449 5,853 39,083 (2,407 (8,492 (3,830 (1,547,545) (257,728) (43,819) 660,028 63,912 189,204 72,665 1,607 1,875 94,955 (452,145) (65,454) 27,237 180,272 22,547 52,380 51,916 26,503 21,980 499,191 208,312 26,761 (29,871 (17,968 (40,757 (18,626 (12,636 8,937 3,643 835,419 OPERATING ACTIVITIES Net income Adjustments to reconcile net income to netcash provided by operating activities: Depreciation and amortization Provision for credit losses Stock-based compensation Deferred income taxes Excess tax benefit on stock-based compensation Other operating activities Changes in operating elements, net of effects of acquisitions: Receivables Contract assets Prepaid expenses and other Accounts payable and outstanding checks Accrued compensation Accrued transportation expense Accrued income taxes Other accrued liabilities Other assets and liabilities Net cash provided by operating activities INVESTING ACTIVITIES Purchases of property and equipment Purchases and development of software Acquisitions, net of cash acquired Other investing activities Net cash used for investing activities FINANCING ACTIVITIES Proceeds from stock issued for employee benefit plans Stock tendered for payment of withholding taxes Repurchase of common stock Cash dividends Proceeds from long-term borrowings Payments on long-term borrowings Proceeds from short-term borrowings Payments on short-term borrowings Net cash provided by (used for) financing activities Effect of exchange rates on cash and cash equivalents Net change in cash and cash equivalents Cash and cash equivalents, beginning of year Cash and cash equivalents, end of year Supplemental cash flow disclosures Cash paid for income taxes Cash paid for interest Accrued share repurchases held in other accrued liabilities (34,197) (36,725) (14,750) 0 (85,672) (23,133) (30,876) (223,230) 5,525 (271,714) (36,290 (34,175 (59,200 16,636 (113,029 70,669 (26,720) (581,756) (277,321) 300,000 (2,048) 3,728,000 (3,203,251) 7,573 (3,239) 13,617 243,796 $ 257,413 $ 107,657 (17854) (177,514) (209,956) 0 0 1,436,600 (1,579,600) (440,667) 9,128 (204,062) 447,858 $ 243,796 $ 63,092 (15,115 (309,444 (277,786 1,298,000 (1,505,000 185,000 (90,000 (651,253 (1,894 69,243 378,615 447,858 $ $ 227,427 51,367 $ 4,293 93,070 47,518 $5,231 219,029 50,854 $0 Competitor Ratio Analysis 2019 UPS CHRW lustry Average 1.45 1.27 1.42 1.30 1.44 1.27 1.32 1.20 0.42 1.56 0.32 0.99 0.94 2.11 0.37 1.79 1.60 24.91 0.32 1.10 0.81 18.09 11.11 Fed Ex Corporation Historical Ratios For the years ended Decemeber 31, 2021, 2020, 2019. 2021 2020 Liquidity Current Ratio 1.51 1.58 Quick Ratio 1.40 1.45 Leverage Ratios Debt to Total Assets Ratio 0.44 0.49 Debt to Equity Ratio 1.51 1.97 Long-Term Debt to Equity 1.41 1.87 Times Interest Earned Ratio 9.42 3.48 Activity Ratios Inventory Turnover 54.58 47.60 Fixed Assets Turnover 2.35 2.06 Total Assets Turnover 1.01 0.94 Accounts Receivable Turnover 6.96 6.85 Average Collection Period 52.47 53.27 Profitability Ratios Gross Profit Margin 61.84 60.66 Operating Profit Margin 6.98 3.49 Net Profit Margin 6.23 1.86 Return on Total Assets (ROA) 6.32 1.75 Return on Stockholder's Equity (ROE) 21.64 7.03 Earnings Per Share (EPS) 19.79 4.92 Price Earnings Ratio 14.90 33.36 48.35 2.29 1.28 7.65 47.74 37.72 2.91 1.40 7.68 47.53 165.21 3.29 5.83 62.62 27.69 1.20 0.77 7.97 46.00 61.64 6.41 0.77 0.99 3.04 2.06 82.42 72.20 13.17 13.25 18.57 90.34 14.75 14.17 11.37 4.68 16.78 3.65 13.86 12.01 10.66 41.75 39.43 6.37 16.81 17.72 Industry average ratios FedEx Coroporation Common Sized Balance Sheets As of May 31, 2021, May 31, 2020, and May 31, 2019 I$s in millions May 31,2021 May 31, 2020 May 31,2019 9% 15% 1% 1% 25% 7% 14% 1% 1% 22% 4% 17% 1% 2% 24% 42% 32% 16% 9% 11% 17% 85% 33% 15% 9% 12% 18% 88% 43% 46% 19% 12% 15% 22% 109% 53% Sex 43% 19% 8% 5% 32% 100% 19% 9% 4% 32% 100% 0% 13% 7% 20% 100% ASSETS: CURRENT ASSETS Cash and cash equivalents Receivables, less allowances of $742 and $390 Spare parts, supplies and fuel less allowances of $349 and $335 Prepaid expenses and other Total current assets PROPERTY AND EQUIPMENT, AT COST Aircraft and related equipment Package handling and ground support equipment Information technology Vehicles and trailers Facilities and other Gross property and equipment Less accumulated depreciation and amortization Net property and equipment OTHER LONG-TERM ASSETS Operating lease right-of-use assets, net Goodwill Other assets Total other long-term assets TOTAL ASSETS LIABILITIES AND COMMON STOCKHOLDERS INVESTMENT: CURRENT LIABILITIES Current portion of long-term debt Accrued salaries and employee benefits Accounts payable Operating lease liabilities Accrued expenses Total current liabilities LONG-TERM DEBT, LESS CURRENT PORTION OTHER LONG-TERM LIABILITIES Deferred Income taxes Pension, postretirement healthcare and other benefit obligations Self-insurance accruals Deferred lease obligations Operating lease liabilities Other liabilities Total other long-term liabilities COMMITMENTS AND CONTINGENCIES COMMON STOCKHOLDERS INVESTMENT Common stock, $0.10 par value: 800 million shares authorized: 318 million shares issued as of May 31, 2021 and 2020 Additional paid-in capital Retained earnings Accumulated other comprehensive loss Treasury stock, at cost Total common stockholders' investment TOTAL LIABILITIES AND COMMON STOCKHOLDERS INVESTMENT OX 49 5% 3% 6% 17% 25% 0% 2% 4% 3% 5% 14% 30% 6% 17% 31 0% 5% 4% 7% 3% 5% 4% 3% 0% 16% 1% 29% 0% 17% 1% 31% 20% 0% 0% 0% 4% 36% - 1% -10% 29% 100% 5% 34% -2% -12% 6% 45% -2% -17% 33% 100% 25% 100% FedEx Coroporation Common Sized Income Statements As of May 31, 2021, May 31,2020, and May 31, 2019 ($s in millions) May 31,2021 100% May 31,2020 100% May 31,2019 100% 36% 26% 5% 5% REVENUE OPERATING EXPENSES: Salaries and employee benefits Purchased transportation Rentals and landing fees Depreciation and amortization Fuel Maintenance and repairs Business realignment costs Goodwill and other asset impairment charges Other TOTAL OPERATING EXPENSES OPERATING INCOME OTHER (EXPENSE) INCOME: Interest expense Interest income Other retirement plans income (expense) Loss on debt extinguishment Other, net TOTAL OTHER (EXPENSE) INCOME INCOME BEFORE INCOME TAXES PROVISION FOR INCOME TAXES NET INCOME BASIC EARNINGS PER COMMON SHARE DILUTED EARNINGS PER COMMON SHARE 3% 4% 0% 0% 14% 93% 7% 36% 25% 5% 5% 5% 4% 0% 1% 15% 97% 3% 36% 24% 5% 5% 6% 4% 0% 0% 14% 94% 6% - 1% 0% 2% 0% 0% 1% 8% 2% 6% 0% 0% - 1% 0% 0% 0% 0% - 1% 2% 1% 2% 0% 0% -1% 0% -5% 0% 0% -5% 1% 0% 1% 0% 0% FedEx Coroporation Horizontal Analysis Balance Sheets As of May 31, 2021, May 31,2020, and May 31, 2019 ($s in millions) May 31 2020 $ May 31, 2019 110% 11% 45% 19% 3% 1% 26% $ 4.881 $ 10,102 $ 5725 3285 16.383 $ 2,562 986 19 (270) 3,297 396 25% 25% $ 2,319 9,116 553 1,098 13,086 7% 14% 9% 24,518 $ 11 382 $ 6.884 $ 9,101 $ 13,139 $ 65 024 $ 31,416 $ 33 608$ 1.725 973 616 762 1,437 7% 8% 996 10% 9% 12% 92 8% 10% 22,793 10,409 6,268 8,339 11,702 59.511 29,082 30 429 5513 98 2,334 3,179 6% 11% 10% 25% 12% 13% 13,917 $ 13,917 6,372 $ (512) 3.257 $ 747) 23.546 $ 12,658 73.537 $ 19,134 -7% -19% 116% 35% 0 6,884 4,004 10,888 54,403 May 31,2021 $ ASSETS: CURRENT ASSETS Cash and cash equivalents $ 7,087 $ 2,206 Receivables, less allowances of $742 and $390 12,069 $ 1.967 Spare parts, supplies and fuel, less allowances of $349 and $335 587 $ 15 Prepaid expenses and other 837 9 Total current assets 20,580 $ 4,197 PROPERTY AND EQUIPMENT, AT COST Aircraft and related equipment 26,268 $ 1,750 Package handling and ground support equipment 13,012 $ 1.630 Information technology 7,486 $ 602 Vehicles and trailers 9,282 $ 181 Facilities and other 14,029 $ 890 Gross property and equipment 70,077 $ 5,053 Less accumulated depreciation and amortization 34,325 $ 2.909 Net property and equipment 35252$ 2.144 OTHER LONG-TERM ASSETS Operating lease right-of-use assets, net 15,383 $ 1,466 Goodwill 6,992 $ 620 Other assets 4,070 $ 813 Total other long-term assets 26,445 $ 2.899 TOTAL ASSETS 82.777 $ 9.240 LIABILITIES AND COMMON STOCKHOLDERS' INVESTMENT: CURRENT LIABILITIES Current portion of long-term debt 146 $ 95 Accrued salaries and employee benefits 2,903 $ 1,334 Accounts payable 3,841 5 572 Operating lease liabilities 2,208 $ 285 Accrued expenses 4,562 $ 1.030 Total current liabilities 13,660 $ 3,316 LONG-TERM DEBT, LESS CURRENT PORTION 20,733 $ (1,219) OTHER LONG-TERM LIABILITIES Deferred income taxes 3,927 $ Pension, postretirement healthcare and other benefit obligations 3,501 $ (1,518) Self-Insurance accruals 2,430 $ 326 Deferred lease obligations Operating lease liabilities 13,375 $ 1.180 Other liabilities 983 $ 517 Total other long-term liabilities 24 216 $ 1.270 COMMITMENTS AND CONTINGENCIES COMMON STOCKHOLDERS' INVESTMENT Common stock, $0.10 par value; 800 million shares authorized: 318 million shares issued as of May 31, 32 $ Additional paid in capital 3,481 $ 125 Retained earnings 29,817 S 4,601 Accumulated other comprehensive loss 1732) $ 415 Treasury stock, at cost (8,430) $ 732 Total common stockholders' investment 24,168 $ 5.873 TOTAL LIABILITIES AND COMMON STOCKHOLDERS' INVESTMENT $ 82,777 $ 9,240 95% -10% 8% 964 1,741 3,030 186% 85% 17% 15% 29% 32% -6% 51 $ 1.569 $ 3,269 $ 1923 $ 3,532 $ 10 344 $ 21,952 $ 1913) (172) 239 1.923 254 1,331 5,335 8% 15% 32% 3,278 9,013 16,617 765 24% -30% 15% 3,162 $ 341 5,019 $ 1761 2,104 $ 205 $ (531) 12,195 $ 12,195 466 $ (204) 22.946 $ 11.930 -1% 11% -100% 2,821 5,095 1,899 531 10% 111% 6% -30% 100% 670 11.016 0% 0% 18% -36% -8% 32% 13% 32 $ 3,356 $ 125 25 216 $ 568 11.147) $ (282) 19,162) $ 127 18.295 538 $ 73,537 $ 19,134 296 33% - 1% 3% 35% 32 3,231 24,648 (865) 19,289) 17,757 $ 54,403 FedEx Coroporation Horizontal Analysis Income Statements As of May 31, 2021, May 31,2020, and May 31, 2019 ($s in millions) May 31,2021 $ $ 83,959 $ 14,742 % 21% May 31,2020 $ 69,217 $ (476) % -1% May 31,2019 $ 69,693 1% 30,173 $ 5,142 21,674 $ 4,208 4,155 $ 443 3,793 $ 178 2,882 $ (274) 3,328 $ 435 116 $ 116 $ (435) 11,981 $ 1,489 78,102 $ 11,302 5,857 $ 3,440 21% 24% 12% 5% -9% 15% REVENUE OPERATING EXPENSES: Salaries and employee benefits Purchased transportation Rentals and landing fees Depreciation and amortization Fuel Maintenance and repairs Business realignment costs Goodwill and other asset impairment charges Other TOTAL OPERATING EXPENSES OPERATING INCOME OTHER (EXPENSE) INCOME: Interest expense Interest income Other retirement plans income (expense) Loss on debt extinguishment Other, net TOTAL OTHER (EXPENSE) INCOME INCOME BEFORE INCOME TAXES PROVISION FOR INCOME TAXES NET INCOME BASIC EARNINGS PER COMMON SHARE DILUTED EARNINGS PER COMMON SHARE 25,031 $ 255 17,466 $ 812 3,712 $ 352 3,615 $ 262 3,156 $ (733) 2,893 $ 59 $ (320) 435 $ 435 10,492 $ 451 66,800 $ 1,573 2,417 $ 2,049) 5% 10% 8% - 19% 2% -100% 24,776 16,654 3,360 3,353 3,889 2,834 320 -100% 14% 17% 142% 4% 2% -46% 10,041 65,227 4,466 18% -5% -1725% (672) $ 55 $ (122) $ (84) (4) 3,129 14% -7% -96% (588) 59 (3,251) (31) (793) $ 52 $ 1,983 $ (393) $ (32) $ 817 $ 6,674 $ 1,443 $ $ 5,231 $ $ 19.79 $ $ 19.45 $ (121) (3) 2,105 (393) (23) 1,565 5,005 1,060 3,945 14.87 256% -209% 300% 277% 307% 302% 297% (9) $ (748) $ 1,669 $ 383 $ $ 1,286 $ $ 4.92 $ $ 4.90 $ 22 3,063 1,014 268 746 2.86 2.87 -71% -80% 155% 233% 138% 139% 141% (3,811) 655 115 $ 540 $ 2.06 $2.03 14.55 FedEx Coroporation Projected Income Statements For May 31, 2022, May 31,2023, and May 31, 2024 ($s in millions) May 31,2022 May 31,2023 May 31,2024 REVENUE OPERATING EXPENSES: Salaries and employee benefits Purchased transportation Rentals and landing fees Depreciation and amortization Fuel Maintenance and repairs Business realignment costs Goodwill and other asset impairment charges Other TOTAL OPERATING EXPENSES OPERATING INCOME OTHER (EXPENSE) INCOME: Interest expense Interest income Other retirement plans income (expense) Loss on debt extinguishment Other, net TOTAL OTHER (EXPENSE) INCOME INCOME BEFORE INCOME TAXES PROVISION FOR INCOME TAXES NET INCOME BASIC EARNINGS PER COMMON SHARE DILUTED EARNINGS PER COMMON SHARE FedEx Coroporation Projected Balance Sheets For May 31, 2022, May 31,2023, and May 31, 2024 I$s in millions) May 31, 2022 May 31, 2023 May 31 2024 ASSETS: CURRENT ASSETS Cash and cash equivalents Receivables, less allowances of $742 and $390 Spare parts, supplies and fuel, less allowances of $349 and $335 Prepaid expenses and other Total current assets PROPERTY AND EQUIPMENT, AT COST Aircraft and related equipment Package handling and ground support equipment Information technology Vehicles and trailers Facilities and other Gross property and equipment Less accumulated depreciation and amortization Net property and equipment OTHER LONG-TERM ASSETS Operating lease right-of-use assets, net Goodwill Other assets Total other long-term assets TOTAL ASSETS LIABILITIES AND COMMON STOCKHOLDERS INVESTMENT: CURRENT LIABILITIES Current portion of long-term debt Accrued salaries and employee benefits Accounts payable Operating lease liabilities Accrued expenses Total current liabilities LONG-TERM DEBT, LESS CURRENT PORTION OTHER LONG-TERM LIABILITIES Deferred income taxes Pension, postretirement healthcare and other benefit obligations Self-Insurance accruals Deferred lease obligations Operating lease liabilities Other liabilities Total other long-term liabilities COMMITMENTS AND CONTINGENCIES COMMON STOCKHOLDERS INVESTMENT Common stock, $0.10 par value; 800 million shares authorized; 318 million shares issued as of May 31, 2021 and 2020 Additional paid-in capital Retained earnings Accumulated other comprehensive loss Treasury stock, at cost Total common stockholders' investment TOTAL LIABILITIES AND COMMON STOCKHOLDERS" INVESTMENT FedEx Coroporation Projected Statement of Cash Flows For May 31, 2022, May 31,2023, and May 31, 2024 ($s in millions) May 31,2022 May 31,2023 May 31,2024 OPERATING ACTIVITIES Net income Adjustments to reconcile net income to cash provided by operating activities: Depreciation and amortization Provision for uncollectible accounts Other noncash items including leases and deferred income tax Stock-based compensation Retirement plans mark-to-market adjustments Loss on extinguishment of debt Gain from sale of business Business realignment costs Goodwill and other asset impairment charges Changes in assets and liabilities: Receivables Other current assets Pension and postretirement healthcare assets and liabilities, net Accounts payable and other liabilities Other, net Cash provided by operating activities INVESTING ACTIVITIES Capital expenditures Business acquisitions, net of cash acquired Proceeds from asset dispositions and other Cash used in investing activities FINANCING ACTIVITIES Payments on debt Proceeds from debt issuances Proceeds from stock issuances Dividends paid Purchase of treasury stock Other, net Cash (used in provided by financing activities Effect of exchange rate changes on cash Net increase (decrease) in cash and cash equivalents Cash and cash equivalents at beginning of period Cash and cash equivalents at end of period Company Name Ticker Symbol Industry Products and Services Offered Major Competitors ACCT 370 Excel Project FedEx Corportion Company Information Karen Romero FedEx Corporation FDX Air Courier Services, Transportation Transportation, e-commerce, and business services United Parcel Service Inc. and C. H. Robinson Worldwide Inc. FedEx Coroporation Consolidated Balance Sheets As of May 31, 2021, May 31, 2020, and May 31, 2019 Iss in millions) May 31,2021 May 31,2020 May 31, 2019 $ 7,087 12,069 587 837 20,580 $4881 10,102 572 828 16,383 $ 2,319 9,116 553 1,098 13,086 26.268 13,012 7,486 9,282 14,029 24,518 11,382 6,884 9,101 13.139 65 31 416 33,608 22,793 10,409 6,268 8,339 11,702 59,511 29.082 30,429 34325 35,752 15,383 6,992 4,070 26,445 82,777 13,917 6,372 3.257 23,546 73,537 6,894 4004 10.888 54,403 ASSETS: CURRENT ASSETS Cash and cash equivalents Receivables, less allowances of $742 and $390 Spare parts, supplies and fuel, less allowances of $349 and $335 Prepaid expenses and other Total current assets PROPERTY AND EQUIPMENT, AT COST Aircraft and related equipment Package handling and ground support equipment Information technology Vehicles and trailers Facilities and other Gross property and equipment Less accumulated depreciation and amortization Net property and equipment OTHER LONG-TERM ASSETS Operating lease right-of-use assets, net Goodwill Other assets Total other long-term assets TOTAL ASSETS LIABILITIES AND COMMON STOCKHOLDERS INVESTMENT: CURRENT LIABILITIES Current portion of long-term debt Accrued salaries and employee benefits Accounts payable Operating lease liabilities Accrued expenses Total current liabilities LONG-TERM DEBT, LESS CURRENT PORTION OTHER LONG-TERM LIABILITIES Deferred income taxes Pension, postretirement healthcare and other benefit obligations Self-insurance accruals Deferred lease obligations Operating lease liabilities Other liabilities Total other long-term liabilities COMMITMENTS AND CONTINGENCIES COMMON STOCKHOLDERS INVESTMENT Common stock, $0.10 par value; 800 million shares authorized: 318 million shares issued as of May 31, 2021 and 2020 Additional paid in capital Retained earnings Accumulated other comprehensive loss Treasury stock, at cost Total common stockholders' investment TOTAL LABILITIES AND COMMON STOCKHOLDERS' INVESTMENT 964 1,741 3,030 146 2,903 3,841 2,208 4,562 13,660 20,733 51 1.569 3,269 1,923 3,532 10,344 21,952 3,278 9013 16,617 3.927 3.501 2,430 3.162 5,019 2,104 2821 5,095 1,899 531 13,375 993 12,195 466 22.946 670 11.016 24216 32 32 32 3,481 29,817 (732) 18.4301 24168 $ 82,777 3.356 25,216 (1.147) 9.162 18 295 $ 73,537 3,231 24,648 (865) 9,289) 17,757 $ 54,403 May 31,2019 $ 69,693 24,776 16,654 3,360 3,353 3,889 2,834 320 FedEx Coroporation Consolidated Statements of Income As of May 31, 2021, May 31,2020, and May 31, 2019 ($sin millions) May 31,2021 May 31,2020 REVENUE $ 83,959 $ 69,217 OPERATING EXPENSES: Salaries and employee benefits 30,173 25,031 Purchased transportation 21,674 17,466 Rentals and landing fees 4,155 3,712 Depreciation and amortization 3,793 3,615 Fuel 2,882 3,156 Maintenance and repairs 3,328 2,893 Business realignment costs 116 Goodwill and other asset impairment charges 435 Other 11,981 10,492 TOTAL OPERATING EXPENSES 78,102 66,800 OPERATING INCOME 5,857 2,417 OTHER (EXPENSE) INCOME: Interest expense (793) (672) Interest income 52 55 Other retirement plans income (expense) 1,983 (122) Loss on debt extinguishment (393) Other, net (32) (9) TOTAL OTHER (EXPENSE) INCOME 817 (748) INCOME BEFORE INCOME TAXES 6,674 1,669 PROVISION FOR INCOME TAXES 1,443 383 NET INCOME $5,231 $1,286 BASIC EARNINGS PER COMMON SHARE $19.79 $4.92 DILUTED EARNINGS PER COMMON SHARE $ 19.45 $ 4.90 10, 041 65,227 4,466 (588) 59 (3,251) (31) (3,811) 655 115 $ 540 $ 2.06 $ 2.03 FedEx Coroporation Consolidated Statement of Cash Flows As of May 31, 2021, May 31,2020, and May 31, 2019 ($s in millions) May 31,2021 May 31,2020 May 31, 2019 $ 5,231 $1,286 $ 540 3,793 577 2,887 200 (1,176) 393 3,615 442 2,449 168 794 3,353 295 (233) 174 3,882 (8) 101 102 435 OPERATING ACTIVITIES Net income Adjustments to reconcile net income to cash provided by operating activities: Depreciation and amortization Provision for uncollectible accounts Other noncash items including leases and deferred income tax Stock-based compensation Retirement plans mark-to-market adjustments Loss on extinguishment of debt Gain from sale of business Business realignment costs Goodwill and other asset impairment charges Changes in assets and liabilities: Receivables Other current assets Pension and postretirement healthcare assets and liabilities, net Accounts payable and other liabilities Other, net Cash provided by operating activities INVESTING ACTIVITIES Capital expenditures Business acquisitions, net of cash acquired Proceeds from asset dispositions and other Cash used in investing activities FINANCING ACTIVITIES Payments on debt Proceeds from debt issuances Proceeds from stock issuances Dividends paid Purchase of treasury stock Other, net Cash (used in provided by financing activities Effect of exchange rate changes on cash Net increase (decrease) in cash and cash equivalents Cash and cash equivalents at beginning of period Cash and cash equivalents at end of period (1,389) (40) (317) 71 (197) 10,135 (1,331) (59) (908) (1,787) (7) 5,097 (873) (25) (909) (571) (113) 5,613 (5,868) (5,884) (228) 102 (6,010) (5,490) (66) 83 (5,473) 22 (5,846) (6,318) 4,212 740 (686) (38) (2,090) 171 2,206 4,881 $ 7,087 (2.548) 6,556 64 (679) (3) (9) 3,381 (70) 2.562 2,319 $ 4,881 (1,436) 2,463 101 (683) (1,480) (4) (1,039) (47) (946) 3,265 $ 2,319 United Parcel Service, Inc. Consolidated Statements of Income As of Dec. 31, 2021, Dec. 31, 2020, and Dec. 31, 2019 ($s in millions, except per share amounts) Dec. 31, 2021 Dec. 31, 2020 Dec 31, 2019 $ 97,287 $ 84,628 $ 74,094 Revenue Operating Expenses: Compensation and benefits Repairs and maintenance Depreciation and amortization Purchased transportation Fuel Other occupancy Other expenses Total Operating Expenses Operating Profit Other Income and (Expense): Investment income (expense) and other Interest expense Total Other Income and (Expense) Income Before Income Taxes Income Tax Expense Net Income Basic Earnings Per Share (in dollars per share) Diluted Earnings Per Share (in dollars per share) 46,707 2,443 2,953 19,058 3,847 1,698 7,771 84,477 12,810 44,529 2,365 2,698 15,631 2,582 1,539 7,600 76,944 7,684 38,908 1,838 2,360 12,590 3,289 1,392 5,919 66,296 7,798 4,479 (694) 3,785 16,595 3,705 $ 12,890 $ 14.75 $ 14.68 (5,139) (701) (5,840) 1,844 501 $ 1,343 $ 1.55 $ 1.54 (1,493) (653) (2,146) 5,652 1,212 $ 4,440 $ 5.14 $ 5.11 United Parcel Service, Inc. Consolidated Balance Sheets As of Dec. 31, 2021, Dec. 31, 2020, and Dec 31, 2019 ($s in millions) Dec. 31, 2021 Dec 31, 2020 Dec 31, 2019 $ 10,225 338 12,669 0 1,800 24,934 33,475 3,562 3,692 2,486 26 176 1,054 69,405 $ 5,910 406 10,750 1,197 1,953 20,216 32,254 3,073 3,367 2,274 25 527 672 62,408 $5,238 503 9,552 0 1,810 17,103 30,482 2,856 3,813 2,167 24 330 1,082 57,857 Current Assets: Cash and cash equivalents Marketable securities Accounts receivable, less allowances Assets held for sale Other current assets Total Current Assets Property, Plant and Equipment, Net Operating Lease, Right-of-Use Asset Goodwill Intangible Assets, Net Investments and Restricted Cash Deferred Income Tax Assets Other Non-Current Assets Total Assets Current Liabilities: Current maturities of long-term debt, commercial paper and finance leases Current maturities of operating leases Accounts payable Accrued wages and withholdings Self-insurance reserves Accrued group welfare and retirement plan contributions Liabilities to be disposed of Other current liabilities Total Current Liabilities Long-Term Debt and Finance Leases Non-current Operating Leases Pension and Postretirement Benefit Obligations Deferred Income Tax Liabilities Other Non-Current Liabilities Shareowners' Equity: Class A Commonstock Class B Common stock Additional paid-in capital Retained eamings Accumulated other comprehensive loss Deferred compensation obligations Less: Treasury stock (0.3 shares in 2021 and 0.4 shares in 2020 and 2019) Total Equity for Controlling Interests Noncontrolling Interests Total Shareowners' Equity Total Liabilities and Share owners' Equity 2,131 580 7,523 3,819 1,048 1,038 0 1,430 17,569 19,784 3,033 2,623 560 6,455 3,569 1,085 927 347 1,450 17,016 22,031 2,540 15,817 488 3,847 3,420 538 5,555 2,552 914 793 0 1,641 15,413 21,818 2,391 10,601 1,632 2,719 8,047 3,125 3,578 $ 2 $ 7 1,343 16,179 (3,278) 16 (16) $ 14,253 16 14,269 69,405 $ 2 $ 7 865 6,896 (7,113) 20 (20) $ 657 12 669 62,408 $ $2 $ 7 150 9,105 (5,997) 26 (26) $3,267 16 3,283 57,857 $ $ United Parcel Service, Inc. Statements of Consolidated Cash Flows As of Dec. 31, 2021, Dec. 31, 2020, and Dec. 31, 2019 ($s in millions) Dec. 31, 2021 Dec. 31, 2020 Dec. 31, 2019 $ 12,890 $ 1,343 $ 4,440 2,953 (2456) (576) 178 1,645 878 137 2,698 7,125 (3.125) 503 (8581 796 917 2,360 3,141 12,362 (185 100 915 74 (2,147) 312 1,265 (245) 151 22 15,007 (1,562) 218 904 1,631 (110) (21) 10.459 (717 698 419 (446 182 20 8,639 (4,194) Cash Flows From Operating Activities: Net Income Adjustments to reconcile net income to net cash from operating activities: Depreciation and amortization Pension and postretirement benefit expense Pension and postretirement benefit contributions Self-insurance reserves Deferred tax benefit) expense Stock compensation expense Other (gains) losses Changes in assets and liabilities, net of effect of acquisitions: Accounts receivable Other assets Accounts payable Accrued wages and with holdings Other liabilities Other operating activities Net cash from operating activities Cash Flows From Investing Activities: Capital expenditures Proceeds from disposals of property, plant and equipment Purchases of marketable securities Sales and maturities of marketable securities Net change in finance receivables Cash paid for business acquisitions, net of cash and cash equivalents acquired Other investing activities Net cash (used in) investing activities Cash Flows From Financing Activities: Net change in short-term debt Proceeds from long-term borrowings Repayments of long-term borrowings Purchases of common stock Issuances of common stock Dividends Other financing activities Net cash (used in) financing activities Effect Of Exchange Rate Changes On Cash, Cash Equivalents and Restricted Cash Net Increase (Decrease) In Cash, Cash Equivalents and Restricted Cash Cash And Cash Equivalents: Beginning of period End of period 872 15,412] 40 (254) 360 44 (20) (41) 15,283) (6,380 65 (561 883 13 (312) 366 34 (602) 18 (3,818) 75 16,061 0 0 12,773) (500) 251 (3,437) (1364) 16,823) (21) 4,345 (2,4621 5,003 (3,3921 (224) 285 (3,374) (353) 14.5171 13 672 310 5.203 (3,096 (1,004 213 (3.194 (166 1.727 20 871 5,910 $ 10,255 5,238 $5.910 4,367 $ 5238 C.H. ROBINSON WORLDWIDE, INC. Consolidated Statements of Income As of Dec. 31, 2021, Dec. 31, 2020, and Dec. 31, 2019 ($s in thousands except per share) Dec. 31, 2021 Dec 31, 2020 Dec 31, 2019 22046574 1,055,564 $ 23,102,138 15147562 1,059,544 $ 16,207,106 14322295 987,213 $ 15,309,508 Revenues: Transportation Sourcing Total revenues Costs and expenses: Purchased transportation and related services Purchased products sourced for resale Personnel expenses Other selling, general, and administrative expenses Total costs and expenses Income from operations Interest and other expenses Income before provision for income taxes Provision for income taxes Net income Other comprehensive (Loss) income Comprehensive income Basic net income per share in dollars per share) Diluted net income per share (in dollars per share) Basic weighted average shares outstanding (in shares) 18,994,574 $955,475 1,543,610 526,371 22,020,030 1,082,108 (59,817) 1,022,291 178,046 844,245 (15,136) $ 829,109 $6.37 $ 6.31 132,482 12,834,608 $960,241 1,242,867 496,122 15,533,838 673,268 (44,937) 628,331 121,910 506,421 30,151 $ 536,572 $ 3.74 $ 3.72 135,532 11,839,433 $ 883,765 1,298,528 497,806 14,519,532 789,976 (47,719) 742,257 165,289 576,968 (4,214) $ 572,754 $ 4.21 $4.19 136,955 Dilutive effect of outstanding stock awards (in shares) 1,352 641 780 Diluted weighted average shares outstanding (in shares) 133,834 136,173 137,735 C.H. ROBINSON WORLDWIDE, INC. Consolidated Balance Sheets As of Dec. 31, 2021, Dec. 31, 2020, and Dec. 31, 2019 ($s in thousands) Dec. 31, 2021 Dec. 31, 2020 Dec 31, 2019 $ 257413 3,963,487 453,660 129,593 4,804,153 442,112 (302,281) 139,831 1,484,754 89,606 $ 243,796 2,449,577 197,176 51, 152 2,941,701 478,982 (300,033) 178,949 1,487,187 113,910 $ 447,858 1,974,381 132,874 85,005 2,640, 118 489,976 (281,553 208 423 1,291,760 90,931 292,559 124,900 92,309 7,028,112 319,785 18,640 84,086 5,144,258 310,860 13,485 85,483 4,641,060 1,813,473 105,828 1,195,099 88,265 984,604 78,231 Current assets: Cash and cash equivalents Receivables, net of allowance for credit loss of $41,542 and $38,113 Contract assets, net of allowance for credit loss Prepaid expenses and other Total current assets Property and equipment Accumulated depreciation and amortization Net property and equipment Goodwill Other intangible assets, net of accumulated amortization of $88,302 and $68,249 Right-of-use lease assets Deferred tax assets Other assets Total assets Current liabilities: Accounts payable Outstanding checks Accrued expenses: Compensation Transportation expense Income taxes Other accrued liabilities Current lease liabilities Current portion of debt Total current liabilities Long-term debt Noncurrent lease liabilities Noncurrent income taxes payable Deferred tax liabilities Other long-term liabilities Total liabilities Commitments and contingencies Stockholders' investment: Preferred stock, $0.10 par value, 20,000 shares authorized; no shares issued or outstanding Common stock, $0,10 par value, 480,000 shares authorized; 179,206 and 179,232 shares issued, 129,186 and 134,298 outstanding Additional paid-in capital Retained eamings Accumulated other comprehensive loss Treasury stock at cost (50,020 and 44,934 shares) Total stockholders' investment Total liabilities and stockholders' investment 201,421 342,778 100,265 171,266 66,311 525,000 3,326,342 1,393,649 241,369 28,390 16,113 315 5,006,178 138,460 153,574 43,700 154,460 66,174 0 1,839,732 1,093,301 268,572 26,015 22,182 14,523 3,264,325 112,784 101,194 12,354 62,706 61,280 142,885 1,556,038 1,092 448 259 444 22,354 39,776 270 2,970,330 0 0 0 12,919 13,430 13,490 673,628 4,936,861 (61, 134) (3,540, 340) 2,021,934 $ 7,028,112 566,022 4,372,833 (45,998) (3,026,354) 1,879,933 $5,144,258 546,646 4,144,834 (76,149 (2,958,091 1,670,730 $ 4,641,060 C.H. ROBINSON WORLDWIDE, INC. Statements of Consolidated Cash Flows As of Dec. 31, 2021, Dec. 31, 2020, and Dec 31, 2019 ($sin thousands) Dec 31, 2021 Dec. 31, 2020 Dec. 31, 2019 $844,245 $ 506 421 $ 576,968 91,259 10,649 129,977 (110,188) (13,101) 1,915 101,727 17,281 43,995 (32,984) (17,581) 15,096 100,449 5,853 39,083 (2,407 (8,492 (3,830 (1,547,545) (257,728) (43,819) 660,028 63,912 189,204 72,665 1,607 1,875 94,955 (452,145) (65,454) 27,237 180,272 22,547 52,380 51,916 26,503 21,980 499,191 208,312 26,761 (29,871 (17,968 (40,757 (18,626 (12,636 8,937 3,643 835,419 OPERATING ACTIVITIES Net income Adjustments to reconcile net income to netcash provided by operating activities: Depreciation and amortization Provision for credit losses Stock-based compensation Deferred income taxes Excess tax benefit on stock-based compensation Other operating activities Changes in operating elements, net of effects of acquisitions: Receivables Contract assets Prepaid expenses and other Accounts payable and outstanding checks Accrued compensation Accrued transportation expense Accrued income taxes Other accrued liabilities Other assets and liabilities Net cash provided by operating activities INVESTING ACTIVITIES Purchases of property and equipment Purchases and development of software Acquisitions, net of cash acquired Other investing activities Net cash used for investing activities FINANCING ACTIVITIES Proceeds from stock issued for employee benefit plans Stock tendered for payment of withholding taxes Repurchase of common stock Cash dividends Proceeds from long-term borrowings Payments on long-term borrowings Proceeds from short-term borrowings Payments on short-term borrowings Net cash provided by (used for) financing activities Effect of exchange rates on cash and cash equivalents Net change in cash and cash equivalents Cash and cash equivalents, beginning of year Cash and cash equivalents, end of year Supplemental cash flow disclosures Cash paid for income taxes Cash paid for interest Accrued share repurchases held in other accrued liabilities (34,197) (36,725) (14,750) 0 (85,672) (23,133) (30,876) (223,230) 5,525 (271,714) (36,290 (34,175 (59,200 16,636 (113,029 70,669 (26,720) (581,756) (277,321) 300,000 (2,048) 3,728,000 (3,203,251) 7,573 (3,239) 13,617 243,796 $ 257,413 $ 107,657 (17854) (177,514) (209,956) 0 0 1,436,600 (1,579,600) (440,667) 9,128 (204,062) 447,858 $ 243,796 $ 63,092 (15,115 (309,444 (277,786 1,298,000 (1,505,000 185,000 (90,000 (651,253 (1,894 69,243 378,615 447,858 $ $ 227,427 51,367 $ 4,293 93,070 47,518 $5,231 219,029 50,854 $0 Competitor Ratio Analysis 2019 UPS CHRW lustry Average 1.45 1.27 1.42 1.30 1.44 1.27 1.32 1.20 0.42 1.56 0.32 0.99 0.94 2.11 0.37 1.79 1.60 24.91 0.32 1.10 0.81 18.09 11.11 Fed Ex Corporation Historical Ratios For the years ended Decemeber 31, 2021, 2020, 2019. 2021 2020 Liquidity Current Ratio 1.51 1.58 Quick Ratio 1.40 1.45 Leverage Ratios Debt to Total Assets Ratio 0.44 0.49 Debt to Equity Ratio 1.51 1.97 Long-Term Debt to Equity 1.41 1.87 Times Interest Earned Ratio 9.42 3.48 Activity Ratios Inventory Turnover 54.58 47.60 Fixed Assets Turnover 2.35 2.06 Total Assets Turnover 1.01 0.94 Accounts Receivable Turnover 6.96 6.85 Average Collection Period 52.47 53.27 Profitability Ratios Gross Profit Margin 61.84 60.66 Operating Profit Margin 6.98 3.49 Net Profit Margin 6.23 1.86 Return on Total Assets (ROA) 6.32 1.75 Return on Stockholder's Equity (ROE) 21.64 7.03 Earnings Per Share (EPS) 19.79 4.92 Price Earnings Ratio 14.90 33.36 48.35 2.29 1.28 7.65 47.74 37.72 2.91 1.40 7.68 47.53 165.21 3.29 5.83 62.62 27.69 1.20 0.77 7.97 46.00 61.64 6.41 0.77 0.99 3.04 2.06 82.42 72.20 13.17 13.25 18.57 90.34 14.75 14.17 11.37 4.68 16.78 3.65 13.86 12.01 10.66 41.75 39.43 6.37 16.81 17.72 Industry average ratios FedEx Coroporation Common Sized Balance Sheets As of May 31, 2021, May 31, 2020, and May 31, 2019 I$s in millions May 31,2021 May 31, 2020 May 31,2019 9% 15% 1% 1% 25% 7% 14% 1% 1% 22% 4% 17% 1% 2% 24% 42% 32% 16% 9% 11% 17% 85% 33% 15% 9% 12% 18% 88% 43% 46% 19% 12% 15% 22% 109% 53% Sex 43% 19% 8% 5% 32% 100% 19% 9% 4% 32% 100% 0% 13% 7% 20% 100% ASSETS: CURRENT ASSETS Cash and cash equivalents Receivables, less allowances of $742 and $390 Spare parts, supplies and fuel less allowances of $349 and $335 Prepaid expenses and other Total current assets PROPERTY AND EQUIPMENT, AT COST Aircraft and related equipment Package handling and ground support equipment Information technology Vehicles and trailers Facilities and other Gross property and equipment Less accumulated depreciation and amortization Net property and equipment OTHER LONG-TERM ASSETS Operating lease right-of-use assets, net Goodwill Other assets Total other long-term assets TOTAL ASSETS LIABILITIES AND COMMON STOCKHOLDERS INVESTMENT: CURRENT LIABILITIES Current portion of long-term debt Accrued salaries and employee benefits Accounts payable Operating lease liabilities Accrued expenses Total current liabilities LONG-TERM DEBT, LESS CURRENT PORTION OTHER LONG-TERM LIABILITIES Deferred Income taxes Pension, postretirement healthcare and other benefit obligations Self-insurance accruals Deferred lease obligations Operating lease liabilities Other liabilities Total other long-term liabilities COMMITMENTS AND CONTINGENCIES COMMON STOCKHOLDERS INVESTMENT Common stock, $0.10 par value: 800 million shares authorized: 318 million shares issued as of May 31, 2021 and 2020 Additional paid-in capital Retained earnings Accumulated other comprehensive loss Treasury stock, at cost Total common stockholders' investment TOTAL LIABILITIES AND COMMON STOCKHOLDERS INVESTMENT OX 49 5% 3% 6% 17% 25% 0% 2% 4% 3% 5% 14% 30% 6% 17% 31 0% 5% 4% 7% 3% 5% 4% 3% 0% 16% 1% 29% 0% 17% 1% 31% 20% 0% 0% 0% 4% 36% - 1% -10% 29% 100% 5% 34% -2% -12% 6% 45% -2% -17% 33% 100% 25% 100% FedEx Coroporation Common Sized Income Statements As of May 31, 2021, May 31,2020, and May 31, 2019 ($s in millions) May 31,2021 100% May 31,2020 100% May 31,2019 100% 36% 26% 5% 5% REVENUE OPERATING EXPENSES: Salaries and employee benefits Purchased transportation Rentals and landing fees Depreciation and amortization Fuel Maintenance and repairs Business realignment costs Goodwill and other asset impairment charges Other TOTAL OPERATING EXPENSES OPERATING INCOME OTHER (EXPENSE) INCOME: Interest expense Interest income Other retirement plans income (expense) Loss on debt extinguishment Other, net TOTAL OTHER (EXPENSE) INCOME INCOME BEFORE INCOME TAXES PROVISION FOR INCOME TAXES NET INCOME BASIC EARNINGS PER COMMON SHARE DILUTED EARNINGS PER COMMON SHARE 3% 4% 0% 0% 14% 93% 7% 36% 25% 5% 5% 5% 4% 0% 1% 15% 97% 3% 36% 24% 5% 5% 6% 4% 0% 0% 14% 94% 6% - 1% 0% 2% 0% 0% 1% 8% 2% 6% 0% 0% - 1% 0% 0% 0% 0% - 1% 2% 1% 2% 0% 0% -1% 0% -5% 0% 0% -5% 1% 0% 1% 0% 0% FedEx Coroporation Horizontal Analysis Balance Sheets As of May 31, 2021, May 31,2020, and May 31, 2019 ($s in millions) May 31 2020 $ May 31, 2019 110% 11% 45% 19% 3% 1% 26% $ 4.881 $ 10,102 $ 5725 3285 16.383 $ 2,562 986 19 (270) 3,297 396 25% 25% $ 2,319 9,116 553 1,098 13,086 7% 14% 9% 24,518 $ 11 382 $ 6.884 $ 9,101 $ 13,139 $ 65 024 $ 31,416 $ 33 608$ 1.725 973 616 762 1,437 7% 8% 996 10% 9% 12% 92 8% 10% 22,793 10,409 6,268 8,339 11,702 59.511 29,082 30 429 5513 98 2,334 3,179 6% 11% 10% 25% 12% 13% 13,917 $ 13,917 6,372 $ (512) 3.257 $ 747) 23.546 $ 12,658 73.537 $ 19,134 -7% -19% 116% 35% 0 6,884 4,004 10,888 54,403 May 31,2021 $ ASSETS: CURRENT ASSETS Cash and cash equivalents $ 7,087 $ 2,206 Receivables, less allowances of $742 and $390 12,069 $ 1.967 Spare parts, supplies and fuel, less allowances of $349 and $335 587 $ 15 Prepaid expenses and other 837 9 Total current assets 20,580 $ 4,197 PROPERTY AND EQUIPMENT, AT COST Aircraft and related equipment 26,268 $ 1,750 Package handling and ground support equipment 13,012 $ 1.630 Information technology 7,486 $ 602 Vehicles and trailers 9,282 $ 181 Facilities and other 14,029 $ 890 Gross property and equipment 70,077 $ 5,053 Less accumulated depreciation and amortization 34,325 $ 2.909 Net property and equipment 35252$ 2.144 OTHER LONG-TERM ASSETS Operating lease right-of-use assets, net 15,383 $ 1,466 Goodwill 6,992 $ 620 Other assets 4,070 $ 813 Total other long-term assets 26,445 $ 2.899 TOTAL ASSETS 82.777 $ 9.240 LIABILITIES AND COMMON STOCKHOLDERS' INVESTMENT: CURRENT LIABILITIES Current portion of long-term debt 146 $ 95 Accrued salaries and employee benefits 2,903 $ 1,334 Accounts payable 3,841 5 572 Operating lease liabilities 2,208 $ 285 Accrued expenses 4,562 $ 1.030 Total current liabilities 13,660 $ 3,316 LONG-TERM DEBT, LESS CURRENT PORTION 20,733 $ (1,219) OTHER LONG-TERM LIABILITIES Deferred income taxes 3,927 $ Pension, postretirement healthcare and other benefit obligations 3,501 $ (1,518) Self-Insurance accruals 2,430 $ 326 Deferred lease obligations Operating lease liabilities 13,375 $ 1.180 Other liabilities 983 $ 517 Total other long-term liabilities 24 216 $ 1.270 COMMITMENTS AND CONTINGENCIES COMMON STOCKHOLDERS' INVESTMENT Common stock, $0.10 par value; 800 million shares authorized: 318 million shares issued as of May 31, 32 $ Additional paid in capital 3,481 $ 125 Retained earnings 29,817 S 4,601 Accumulated other comprehensive loss 1732) $ 415 Treasury stock, at cost (8,430) $ 732 Total common stockholders' investment 24,168 $ 5.873 TOTAL LIABILITIES AND COMMON STOCKHOLDERS' INVESTMENT $ 82,777 $ 9,240 95% -10% 8% 964 1,741 3,030 186% 85% 17% 15% 29% 32% -6% 51 $ 1.569 $ 3,269 $ 1923 $ 3,532 $ 10 344 $ 21,952 $ 1913) (172) 239 1.923 254 1,331 5,335 8% 15% 32% 3,278 9,013 16,617 765 24% -30% 15% 3,162 $ 341 5,019 $ 1761 2,104 $ 205 $ (531) 12,195 $ 12,195 466 $ (204) 22.946 $ 11.930 -1% 11% -100% 2,821 5,095 1,899 531 10% 111% 6% -30% 100% 670 11.016 0% 0% 18% -36% -8% 32% 13% 32 $ 3,356 $ 125 25 216 $ 568 11.147) $ (282) 19,162) $ 127 18.295 538 $ 73,537 $ 19,134 296 33% - 1% 3% 35% 32 3,231 24,648 (865) 19,289) 17,757 $ 54,403 FedEx Coroporation Horizontal Analysis Income Statements As of May 31, 2021, May 31,2020, and May 31, 2019 ($s in millions) May 31,2021 $ $ 83,959 $ 14,742 % 21% May 31,2020 $ 69,217 $ (476) % -1% May 31,2019 $ 69,693 1% 30,173 $ 5,142 21,674 $ 4,208 4,155 $ 443 3,793 $ 178 2,882 $ (274) 3,328 $ 435 116 $ 116 $ (435) 11,981 $ 1,489 78,102 $ 11,302 5,857 $ 3,440 21% 24% 12% 5% -9% 15% REVENUE OPERATING EXPENSES: Salaries and employee benefits Purchased transportation Rentals and landing fees Depreciation and amortization Fuel Maintenance and repairs Business realignment costs Goodwill and other asset impairment charges Other TOTAL OPERATING EXPENSES OPERATING INCOME OTHER (EXPENSE) INCOME: Interest expense Interest income Other retirement plans income (expense) Loss on debt extinguishment Other, net TOTAL OTHER (EXPENSE) INCOME INCOME BEFORE INCOME TAXES PROVISION FOR INCOME TAXES NET INCOME BASIC EARNINGS PER COMMON SHARE DILUTED EARNINGS PER COMMON SHARE 25,031 $ 255 17,466 $ 812 3,712 $ 352 3,615 $ 262 3,156 $ (733) 2,893 $ 59 $ (320) 435 $ 435 10,492 $ 451 66,800 $ 1,573 2,417 $
Step by Step Solution
There are 3 Steps involved in it

Get step-by-step solutions from verified subject matter experts