

Question: Instructions: Create a residual plot of the following data using the regression line y = 2.9 + 0.34x. ( (5, 5), (7, 3), (9, 9),
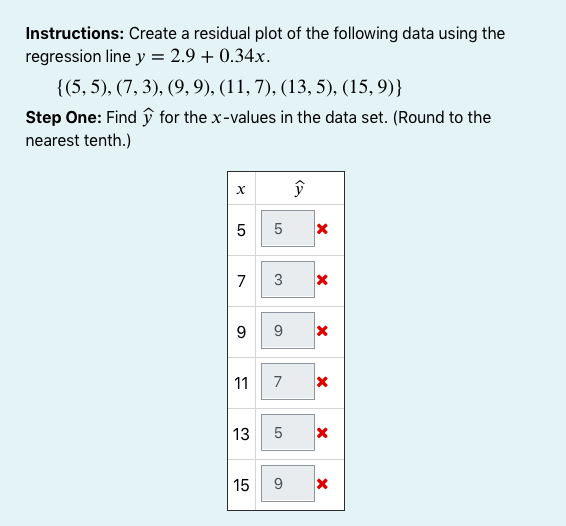
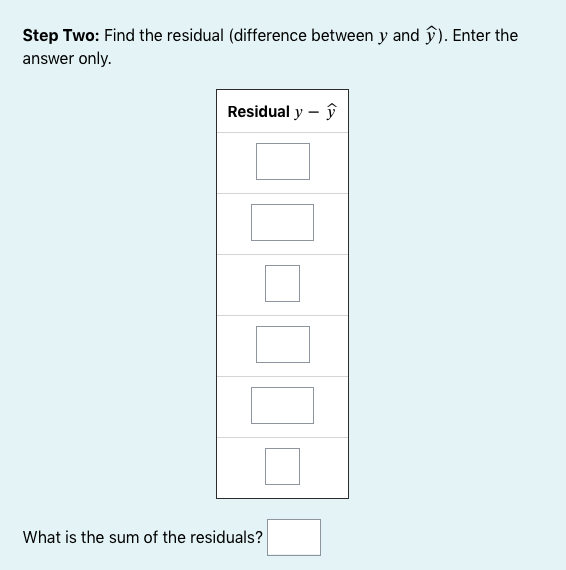
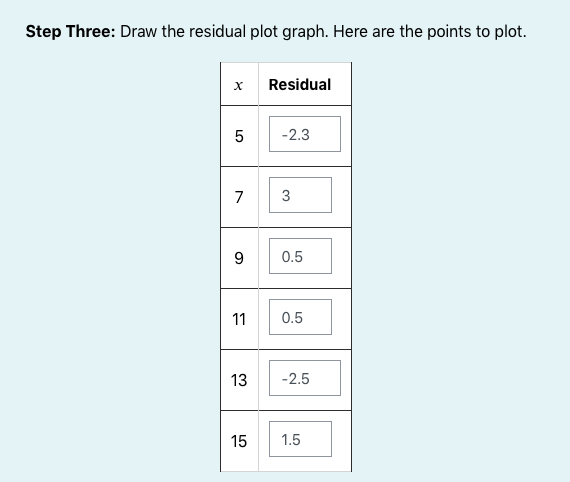
Instructions: Create a residual plot of the following data using the regression line y = 2.9 + 0.34x. ( (5, 5), (7, 3), (9, 9), (11, 7), (13, 5), (15,9)} Step One: Find y for the x-values in the data set. (Round to the nearest tenth.) X 5 5 X 7 X 9 9 X 11 7 X 13 5 X 15 9 XStep Two: Find the residual (difference between ) and y). Enter the answer only. Residual y - y What is the sum of the residuals?Step Three: Draw the residual plat graph. Here are the paints ta plat. 3:: Residual
Step by Step Solution
There are 3 Steps involved in it
1 Expert Approved Answer
Step: 1 Unlock

Question Has Been Solved by an Expert!
Get step-by-step solutions from verified subject matter experts
Step: 2 Unlock
Step: 3 Unlock