

Question: Instructions: Create an NPV table (1) The current table only include Year 1-3. Please create Year 4. Model Inputs Sales Volume Growth, machines Initial Sales
Instructions: "Create an NPV table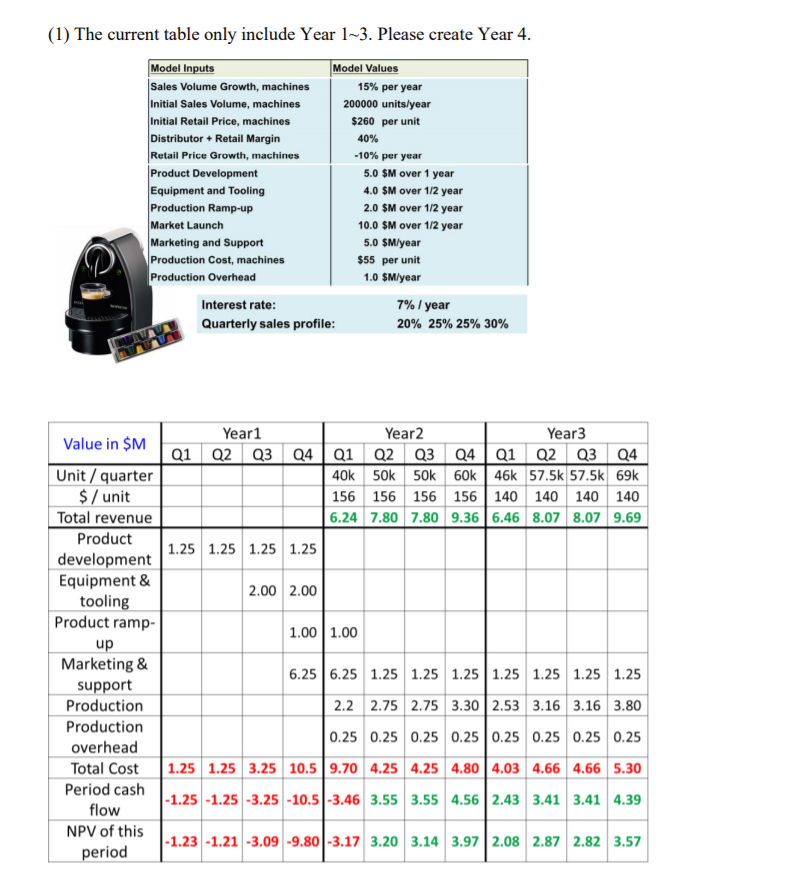
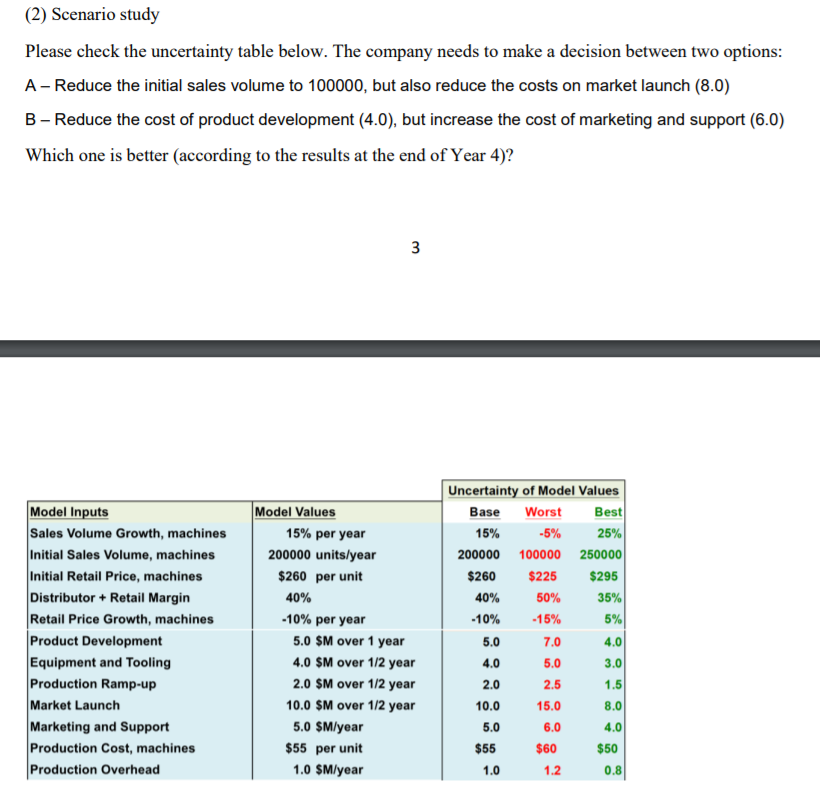
(1) The current table only include Year 1-3. Please create Year 4. Model Inputs Sales Volume Growth, machines Initial Sales Volume, machines Initial Retail Price, machines Distributor + Retail Margin Retail Price Growth, machines Product Development Equipment and Tooling Production Ramp-up Market Launch Marketing and Support Production Cost, machines Production Overhead Model Values 15% per year 200000 units/year $260 per unit 40% -10% per year 5.0 SM over 1 year 4.0 SM over 12 year 2.0 SM over 1/2 year 10.0 SM over 1/2 year 5.0 $M/year $55 per unit 1.0 $M/year Interest rate: Quarterly sales profile: 7% / year 20% 25% 25% 30% Value in $M Year1 Year2 Year3 Q1 Q2 Q3 Q4Q1 Q2 Q3 Q4Q1 Q2 Q3 Q4 40k 50k 50k 60k 46k 57.5k 57.5k 69k 156 156 156 156 140 140 140 140 6.24 7.80 7.80 9.366.46 8.07 8.07 9.69 1.25 1.25 1.25 1.25 2.00 2.00 1.00 1.00 Unit / quarter $ / unit Total revenue Product development Equipment & tooling Product ramp- up Marketing & support Production Production overhead Total Cost Period cash flow NPV of this period 6.25 6.25 1.25 1.25 1.25 1.25 1.25 1.25 1.25 2.2 2.75 2.75 3.302.53 3.16 3.16 3.80 0.25 0.25 0.25 0.25 0.25 0.25 0.25 0.25 1.25 1.25 3.25 10.5 9.70 4.25 4.25 4.80 4.03 4.66 4.66 5.30 - 1.25 -1.25 -3.25 -10.5-3.46 3.55 3.55 4.56 2.43 3.41 3.41 4.39 -1.23 -1.21 -3.09 -9.80 -3.17 3.20 3.14 3.97 2.08 2.87 2.82 3.57 (2) Scenario study Please check the uncertainty table below. The company needs to make a decision between two options: A - Reduce the initial sales volume to 100000, but also reduce the costs on market launch (8.0) B - Reduce the cost of product development (4.0), but increase the cost of marketing and support (6.0) Which one is better according to the results at the end of Year 4)? $295 Uncertainty of Model Values Base Worst Best 15% -5% 25% 200000 100000 250000 $260 $225 50% 35% -10% -15% 5.0 7.0 4.0 4.0 5.0 3.0 Model Inputs Sales Volume Growth, machines Initial Sales Volume, machines Initial Retail Price, machines Distributor + Retail Margin Retail Price Growth, machines Product Development Equipment and Tooling Production Ramp-up Market Launch Marketing and Support Production Cost, machines Production Overhead 40% Model Values 15% per year 200000 units/year $260 per unit 40% -10% per year 5.0 SM over 1 year 4.0 SM over 1/2 year 2.0 SM over 1/2 year 10.0 $M over 1/2 year 5.0 $M/year $55 per unit 1.0 $M/year $55 $60 1.2 1.0 (1) The current table only include Year 1-3. Please create Year 4. Model Inputs Sales Volume Growth, machines Initial Sales Volume, machines Initial Retail Price, machines Distributor + Retail Margin Retail Price Growth, machines Product Development Equipment and Tooling Production Ramp-up Market Launch Marketing and Support Production Cost, machines Production Overhead Model Values 15% per year 200000 units/year $260 per unit 40% -10% per year 5.0 SM over 1 year 4.0 SM over 12 year 2.0 SM over 1/2 year 10.0 SM over 1/2 year 5.0 $M/year $55 per unit 1.0 $M/year Interest rate: Quarterly sales profile: 7% / year 20% 25% 25% 30% Value in $M Year1 Year2 Year3 Q1 Q2 Q3 Q4Q1 Q2 Q3 Q4Q1 Q2 Q3 Q4 40k 50k 50k 60k 46k 57.5k 57.5k 69k 156 156 156 156 140 140 140 140 6.24 7.80 7.80 9.366.46 8.07 8.07 9.69 1.25 1.25 1.25 1.25 2.00 2.00 1.00 1.00 Unit / quarter $ / unit Total revenue Product development Equipment & tooling Product ramp- up Marketing & support Production Production overhead Total Cost Period cash flow NPV of this period 6.25 6.25 1.25 1.25 1.25 1.25 1.25 1.25 1.25 2.2 2.75 2.75 3.302.53 3.16 3.16 3.80 0.25 0.25 0.25 0.25 0.25 0.25 0.25 0.25 1.25 1.25 3.25 10.5 9.70 4.25 4.25 4.80 4.03 4.66 4.66 5.30 - 1.25 -1.25 -3.25 -10.5-3.46 3.55 3.55 4.56 2.43 3.41 3.41 4.39 -1.23 -1.21 -3.09 -9.80 -3.17 3.20 3.14 3.97 2.08 2.87 2.82 3.57 (2) Scenario study Please check the uncertainty table below. The company needs to make a decision between two options: A - Reduce the initial sales volume to 100000, but also reduce the costs on market launch (8.0) B - Reduce the cost of product development (4.0), but increase the cost of marketing and support (6.0) Which one is better according to the results at the end of Year 4)? $295 Uncertainty of Model Values Base Worst Best 15% -5% 25% 200000 100000 250000 $260 $225 50% 35% -10% -15% 5.0 7.0 4.0 4.0 5.0 3.0 Model Inputs Sales Volume Growth, machines Initial Sales Volume, machines Initial Retail Price, machines Distributor + Retail Margin Retail Price Growth, machines Product Development Equipment and Tooling Production Ramp-up Market Launch Marketing and Support Production Cost, machines Production Overhead 40% Model Values 15% per year 200000 units/year $260 per unit 40% -10% per year 5.0 SM over 1 year 4.0 SM over 1/2 year 2.0 SM over 1/2 year 10.0 $M over 1/2 year 5.0 $M/year $55 per unit 1.0 $M/year $55 $60 1.2 1.0
Step by Step Solution
There are 3 Steps involved in it

Get step-by-step solutions from verified subject matter experts