

Question: Instructions Download a Data Set: 1. Choose a data set that interests you from either the Kaggle website or the Tableau Public website. Ensure that
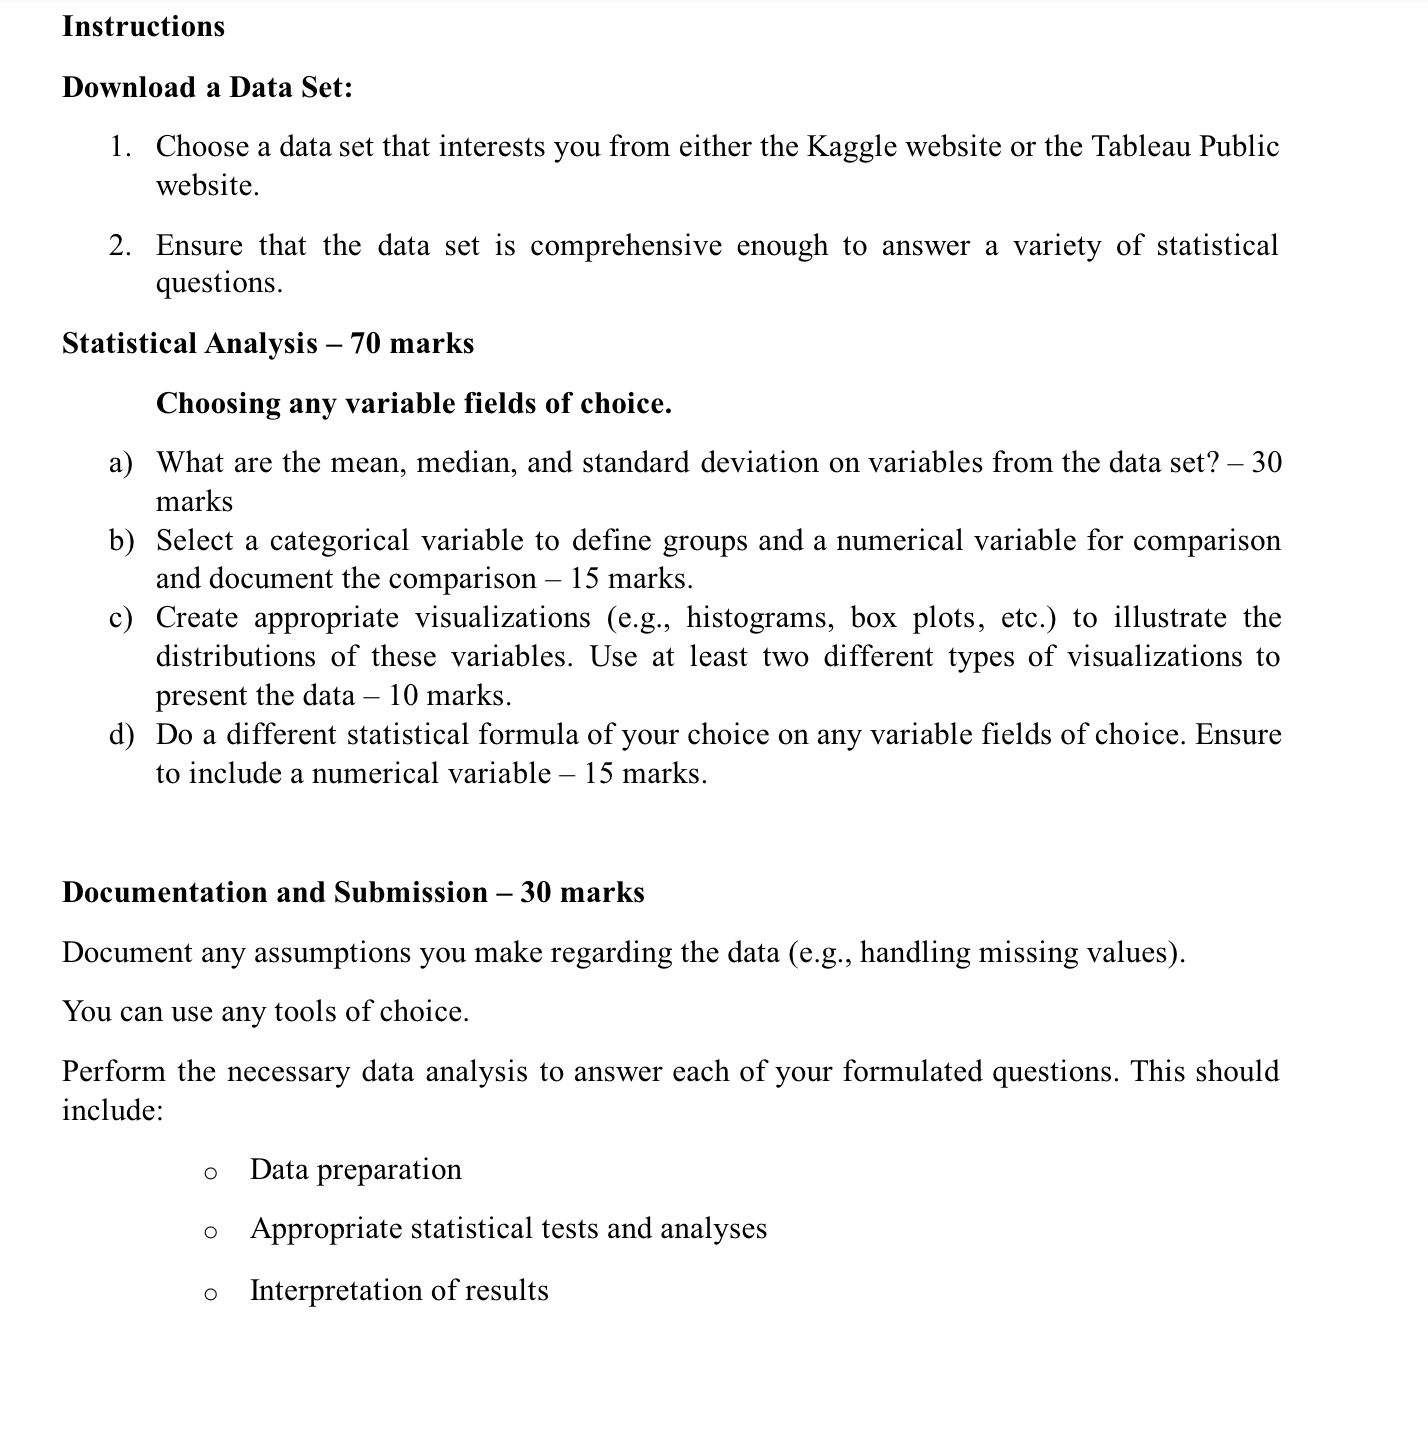
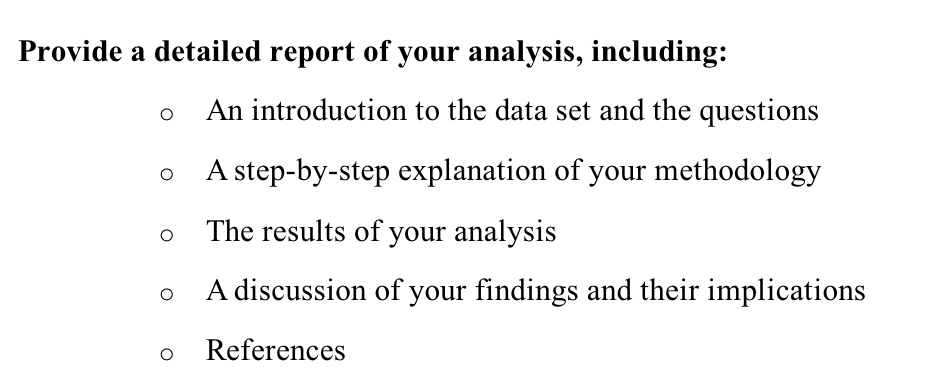
Instructions Download a Data Set: 1. Choose a data set that interests you from either the Kaggle website or the Tableau Public website. Ensure that the data set is comprehensive enough to answer a variety of statistical questions. Statistical Analysis 70 marks b) c) d) Choosing any variable fields of choice. What are the mean, median, and standard deviation on variables from the data set? 30 marks Select a categorical variable to define groups and a numerical variable for comparison and document the comparison 15 marks. Create appropriate visualizations (e.g., histograms, box plots, etc.) to illustrate the distributions of these variables. Use at least two different types of visualizations to present the data 10 marks. Do a different statistical formula of your choice on any variable fields of choice. Ensure to include a numerical variable 15 marks. Documentation and Submission 30 marks Document any assumptions you make regarding the data (e.g., handling missing values). You can use any tools of choice. Perform the necessary data analysis to answer each of your formulated questions. This should include: o Data preparation o Appropriate statistical tests and analyses o Interpretation of results Provide a detailed report of your analysis, including: O O An introduction to the data set and the questions A step-by-step explanation of your methodology The results of your analysis A discussion of your findings and their implications References
Step by Step Solution
There are 3 Steps involved in it

Get step-by-step solutions from verified subject matter experts