

Question: INSTRUCTIONS download observation data from BOM website ( one city per team ) . Download all the weather data of the past 1 2 months
INSTRUCTIONS
download observation data from BOM website one city per team
Download all the weather data of the past months for your chosen city. Note: Exclude the current month, ie if its May, download data from May to April Rename each csv file using yearmonth iecsv Include all the csv files in the same folder and upload it to matlab
Team: Melbourne
Present temperature information
Line plot daily maximum and minimum temperature on the same graph.
Note: use subplot to include monthly graphs on the same figure.
Calculate the total number of days with comfortable temperature degrees Celsius and show the result on the Command Window.
Present daily rainfall information
Bar plot daily rainfall data of a year axis: days, axis: daily rainfall
Calculate the number of days with
a no rain;
b normal rain ;
c heavy rain
Plot the three categories on a pie chart.
Calculate
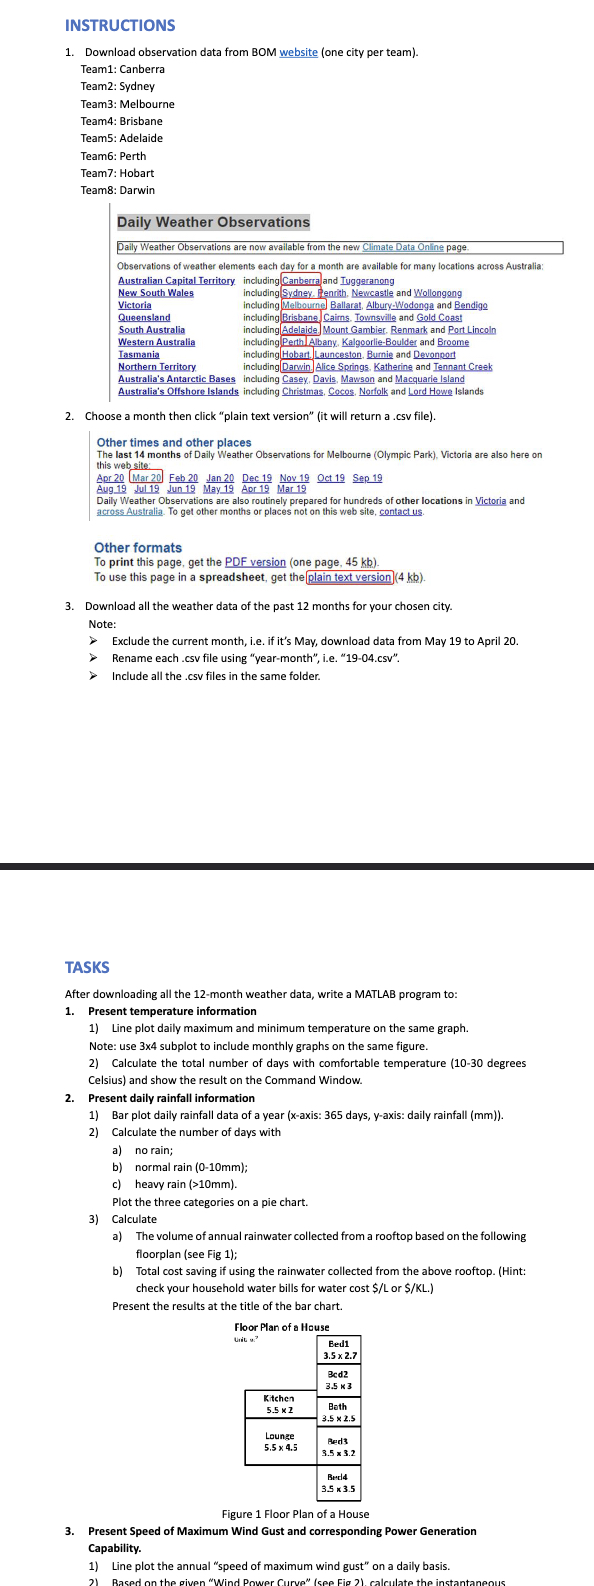
a The volume of annual rainwater collected from a rooftop based on the following floorplan see Fig ;
b Total cost saving if using the rainwater collected from the above rooftop. Hint: check your household water bills for water cost or
Present the results at the title of the bar chart.
Figure Floor Plan of a House
Present Speed of Maximum Wind Gust and corresponding Power Generation Capability.
Line plot the annual "speed of maximum wind gust" on a daily basis.
Step by Step Solution
There are 3 Steps involved in it
1 Expert Approved Answer
Step: 1 Unlock

Question Has Been Solved by an Expert!
Get step-by-step solutions from verified subject matter experts
Step: 2 Unlock
Step: 3 Unlock