Question: Instructions: Enter your answer rounded to 1 decimal place. Do not use a negative (-) sign. What is the opportunity cost of one more candy

Instructions: Enter your answer rounded to 1 decimal place. Do not use a negative (-) sign.
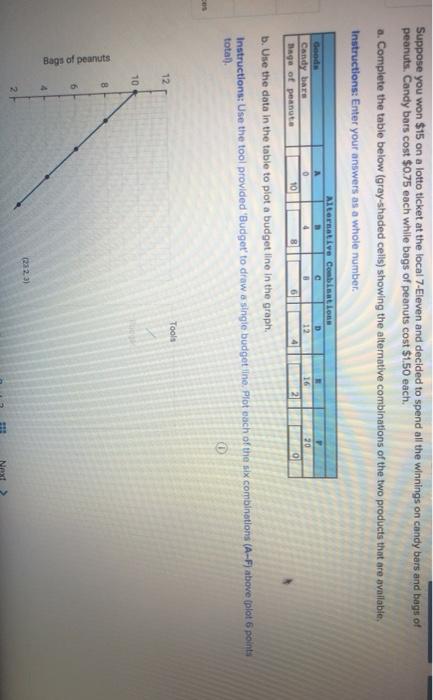
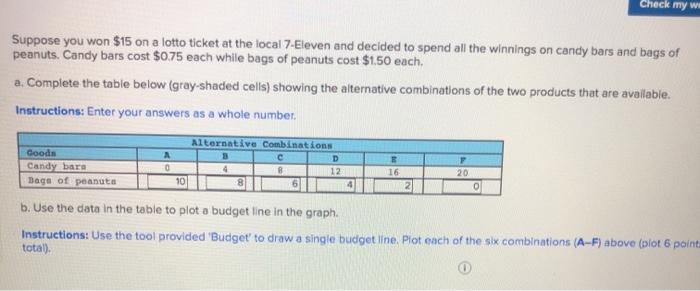
What is the opportunity cost of one more candy bar?
______bag(s) of peanuts
Do these opportunity costs rise, fall, or remain constant as additional units are purchased?
a)Rise b)Fall c)Remain constant
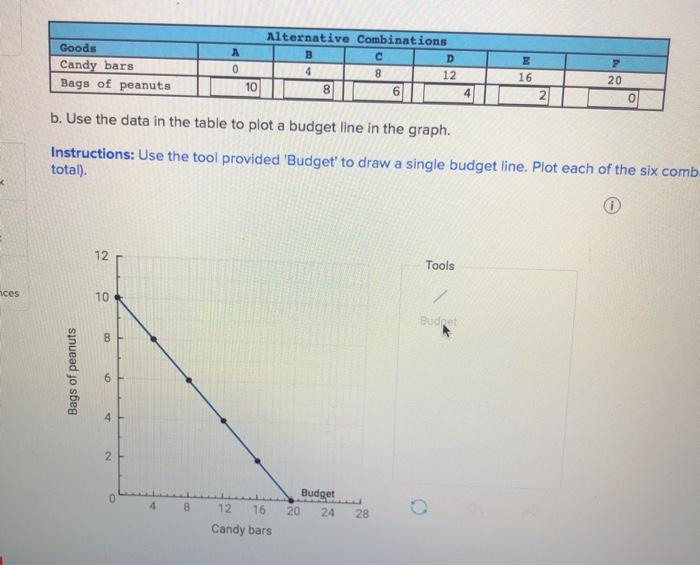
c. Does the budget line tell you which of the available combinations of candy bars and bags of peanuts to buy?
Yes or No
d. Suppose that you had won $30 on your ticket, not $15. Is the slope of a new budget line flatter, steeper, or the same as in the diagram above?
a)Flatter b) Steeper c) The same
Has the number of available combinations increased or decreased?
Increased or Decreased
Instructions: Enter your answer rounded to 1
Suppose you won $15 on a lotto ticket at the local 7-Eleven and decided to spend all the winnings on candy bars and bags of peanuts. Candy bars cost $0.75 each while bags of peanuts cost $1.50 each. a. Complete the table below (gray-shaded cells) showing the alternative combinations of the two products that are available, Instructions: Enter your answers as a whole number Alternative combinations Good Candy bars Diage of peanute b. Use the data in the table to plot a budget line in the graph. Instructions: Use the tool provided Budget to draw a single budget line. Plot each of the six combinations (A-F) above plot 6 points total) 0 D 12 4 16 10 20 NO 6 Tools 12 10 8 Bags of peanuts 02323) Check my we Suppose you won $15 on a lotto ticket at the local 7-Eleven and decided to spend all the winnings on candy bars and bags of peanuts. Candy bars cost $0.75 each while bags of peanuts cost $1.50 each a. Complete the table below (gray-shaded cells) showing the alternative combinations of the two products that are available. Instructions: Enter your answers as a whole number. Goods Candy bara Bago of peanuts Alternative Combinations D B 12 8 6 E 16 2 F 20 10 0 b. Use the data in the table to plot a budget line in the graph. Instructions: Use the tool provided Budget' to draw a single budget line, Plot each of the six combinations (A-F) above (plot 6 points total). Goods Candy bars Bags of peanuts A 0 10 alternative Combinations B D 8 12 6 E 16 20 0 b. Use the data in the table to plot a budget line in the graph. Instructions: Use the tool provided 'Budget' to draw a single budget line. Plot each of the six comb total). 0 12 Tools ces 10 Budget 00 Bags of peanuts 6 4 2 0 4 8 Budget 20 24 28 12 16 Candy bars

Step by Step Solution

There are 3 Steps involved in it

1 Expert Approved Answer
Step: 1 Unlock blur-text-image
Question Has Been Solved by an Expert!

Get step-by-step solutions from verified subject matter experts

Step: 2 Unlock
Step: 3 Unlock

Students Have Also Explored These Related General Management Questions!