

Question: Instructions for Paragraph 1, 2 and 3. I need to help in having an idea of a description of population, sample ans statistic for the
Instructions for Paragraph 1, 2 and 3. I need to help in having an idea of a description of population, sample ans statistic for the study in Part 3. Null and alternative hypothesis for both tests for this project in words. Thanks

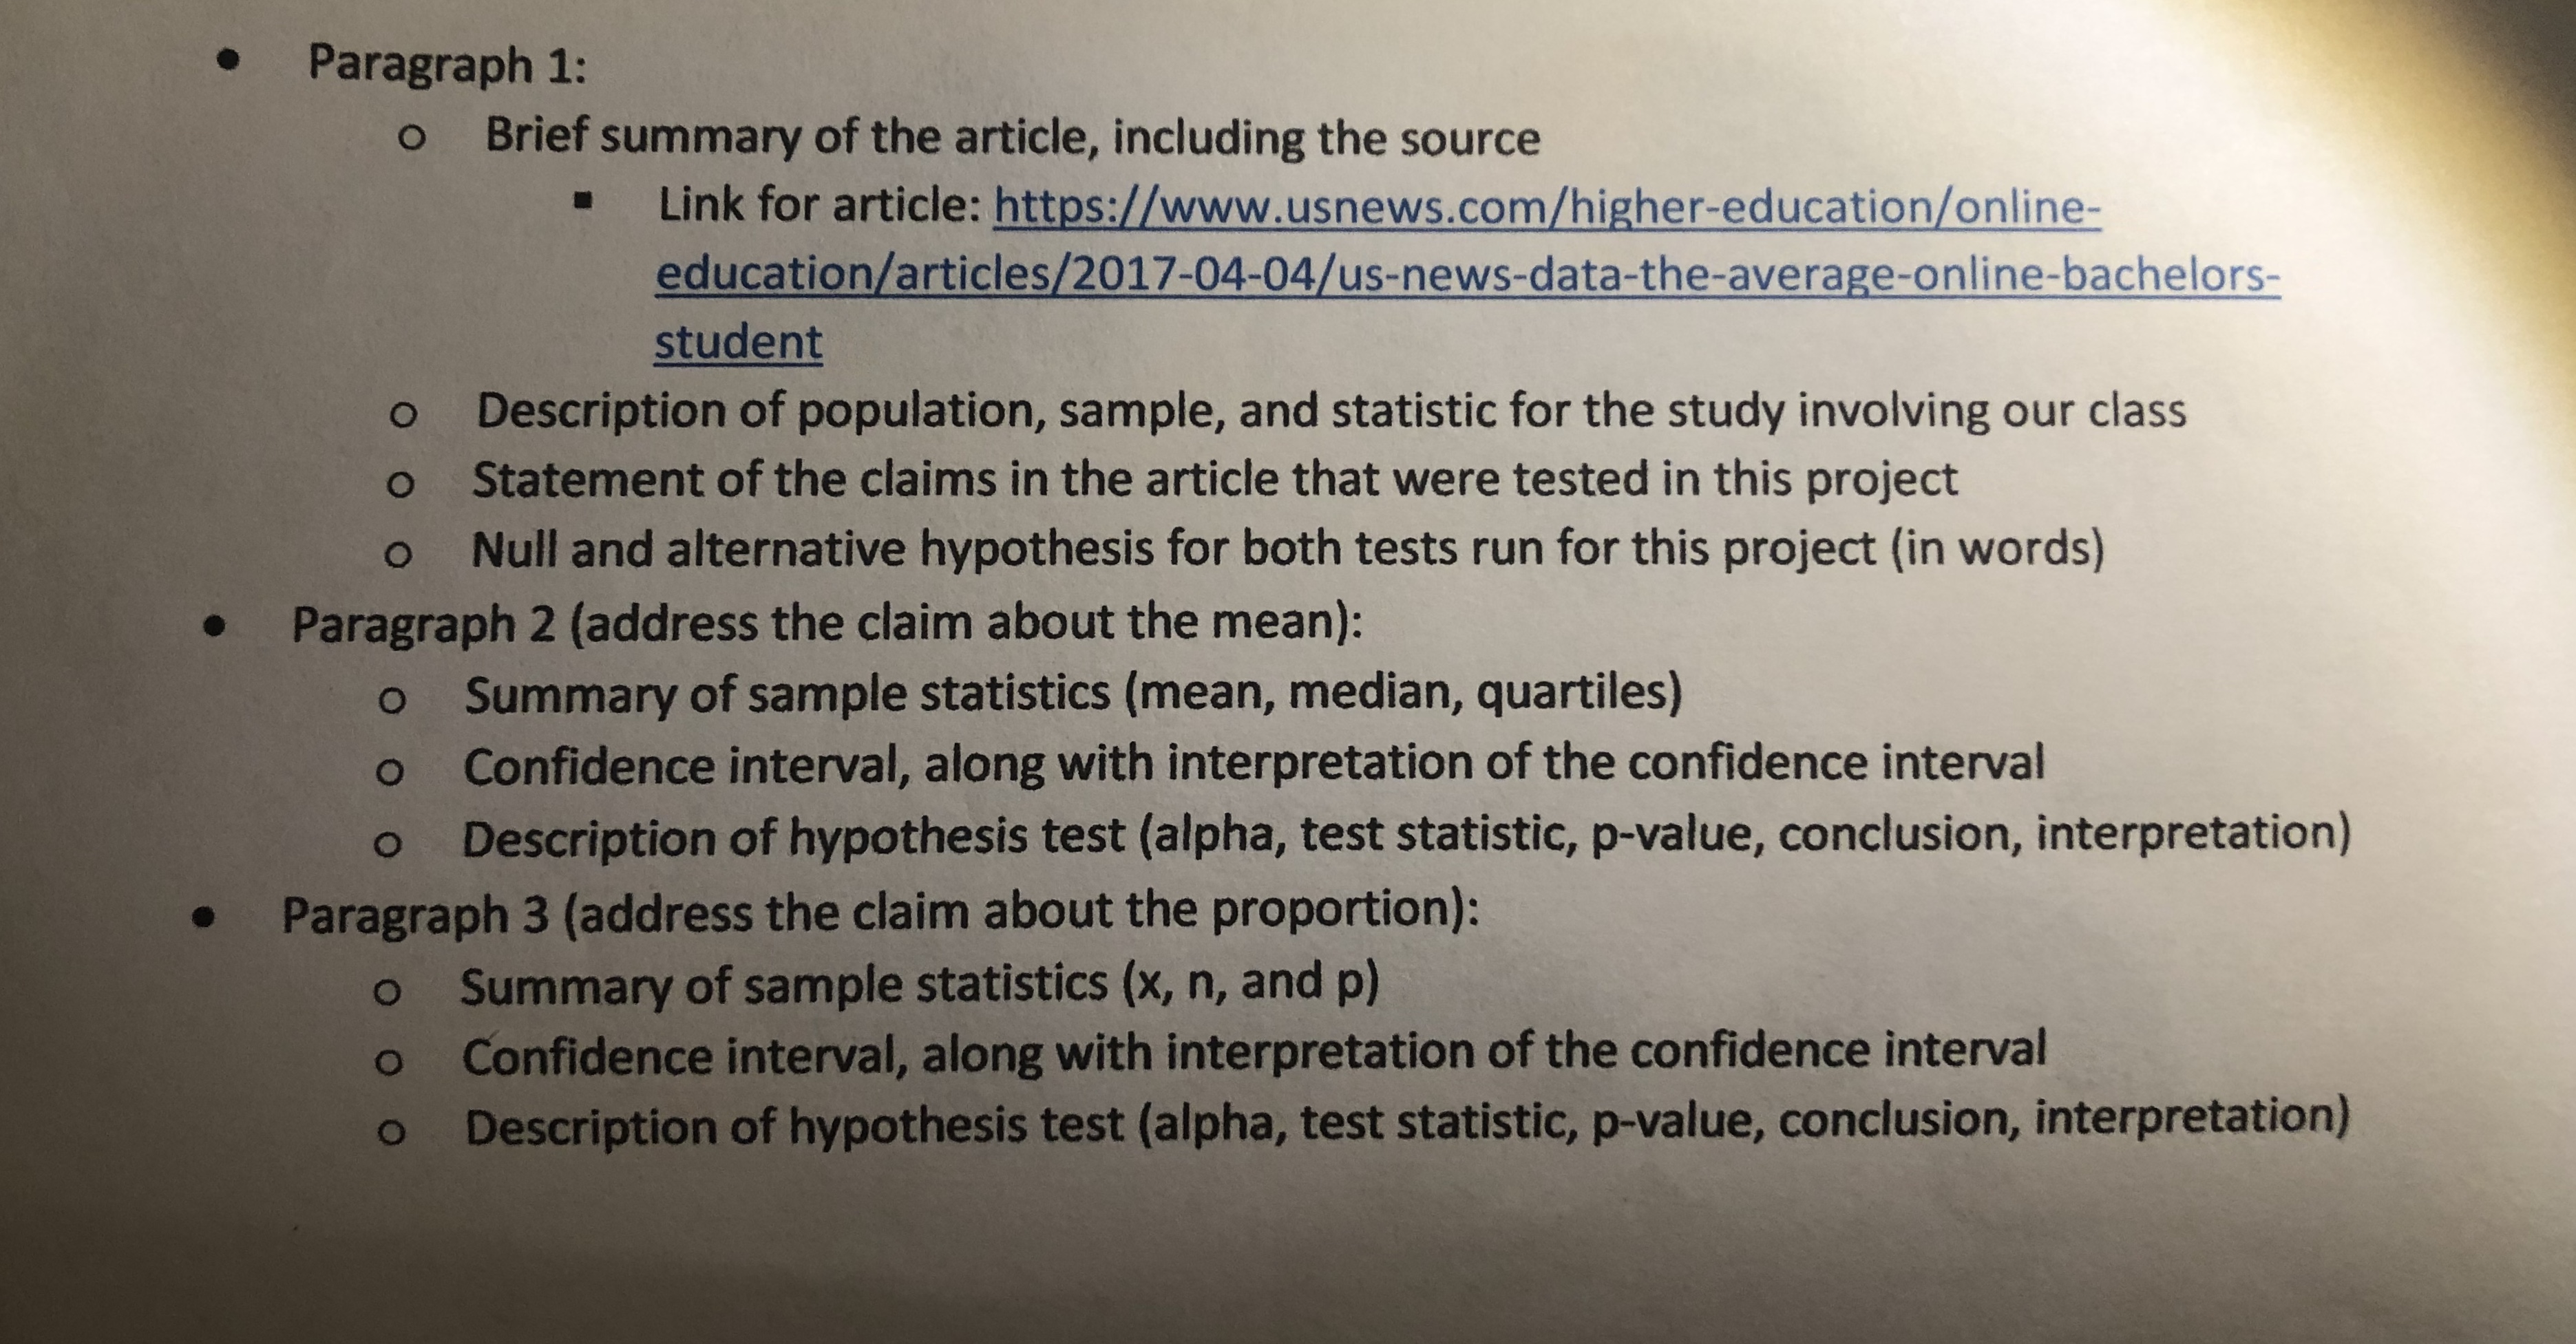
Age Gender 54 F 55 M 21 M 53 F 38 F 49 M 49 M 53 F 34 M 29 M 34 F 38 F 26 F 47 F 24 F 25 F 38 F 20 F 53 F 21 M 30 F 42 F 56 F 39 F 35 F For the following questions, use only the "age" column: Points Limits Freq. Mid. RF CF 1 1 1 1 1 2 2 2 2 2 Ogive: Polygon 5 5 25 Age Frequency Distribution: Class Limits Low High Midpoint 20 27 23.5 28 35 31.5 36 43 39.5 44 51 47.5 52 59 55.5 Class Width Freq. 6 5 5 3 6 Relative Cumulative Frequency Relative Freq 0.2400 0.2400 0.2000 0.4400 0.2000 0.6400 0.1200 0.7600 0.2400 1.0000 Mean 38.52 *Round to two decimals Median 38 *Round to one decimal Sample Standard deviation: 12.03 *Round to two decimals Q1 27.5 *Round to one decimal Q3 51 *Round to one decimal Ogive: 8 Polygon: Age Gender 54 F 55 M 21 M 53 F 38 F 49 M 49 M 53 F 34 M 29 M 34 F 38 F 26 F 47 F 24 F 25 F 38 F 20 F 53 F 21 M 30 F 42 F 56 F 39 F 35 F Points 95% Confidence Interval for Average Age of Online College Students: 1 Sample Mean: Sample St. Dev: Sample Size: 2 Distribution: 2 Critical Value: 2 1 1 Margin of Error: Lower Bound: Upper Bound: 2 38.52 12.03 *2 decimals *2 decimals Calculation: *2 decimals Calculation: *2 decimals Calculation: Interpret 95% Confidence Interval for Proportion of Male Online College Students: 1 1 2 Sample Size: Number of Males: Male Proportion: 2 Distribution: 2 Critical Value: 2 1 1 Margin of Error: Lower Bound: Upper Bound: 2 Interpret 25 Total Points Female Proportion *2 decimals *4 decimals Calculation: *4 decimals Calculation: *4 decimals Calculation: of Online College Students: ale Online College Students: *4 decimals For the following two hypothesis tests, use the alpha = .05 level of confidence Points 1 2 Claim: The average age of online students is 32 years old. Ho: Ha: Sample mean: Sample St. Dev: 2 Distribution: 2 2 Test Statistic: p-value: 3 Interpretation: 38.52 12.03 *2 decimals Calculation: *4 decimals Claim: The proportion of males in online classes is 35% 1 2 Ho: Ha: Sample Proportion Males 2 Distribution: 3 2 Test Statistic: p-value: 3 Interpretation: 25 Total Points 0 Sample Proportion Females *2 decimals Calculation: *4 decimals 0 . Paragraph 1: o Brief summary of the article, including the source Link for article: https://www.usnews.com/higher-education/online- education/articles/2017-04-04/us-news-data-the-average-online-bachelors- student o Description of population, sample, and statistic for the study involving our class o Statement of the claims in the article that were tested in this project o Null and alternative hypothesis for both tests run for this project (in words) Paragraph 2 (address the claim about the mean): o Summary of sample statistics (mean, median, quartiles) o Confidence interval, along with interpretation of the confidence interval o Description of hypothesis test (alpha, test statistic, p-value, conclusion, interpretation) . Paragraph 3 (address the claim about the proportion): o Summary of sample statistics (x, n, and p) o Confidence interval, along with interpretation of the confidence interval o Description of hypothesis test (alpha, test statistic, p-value, conclusion, interpretation)
Step by Step Solution
There are 3 Steps involved in it

Get step-by-step solutions from verified subject matter experts