

Question: Instructions For this assignment, you are requested to classify each treatment of the Get-A-Well Wishing Spa Menu as a star, plow-horse, puzzle or dog, based
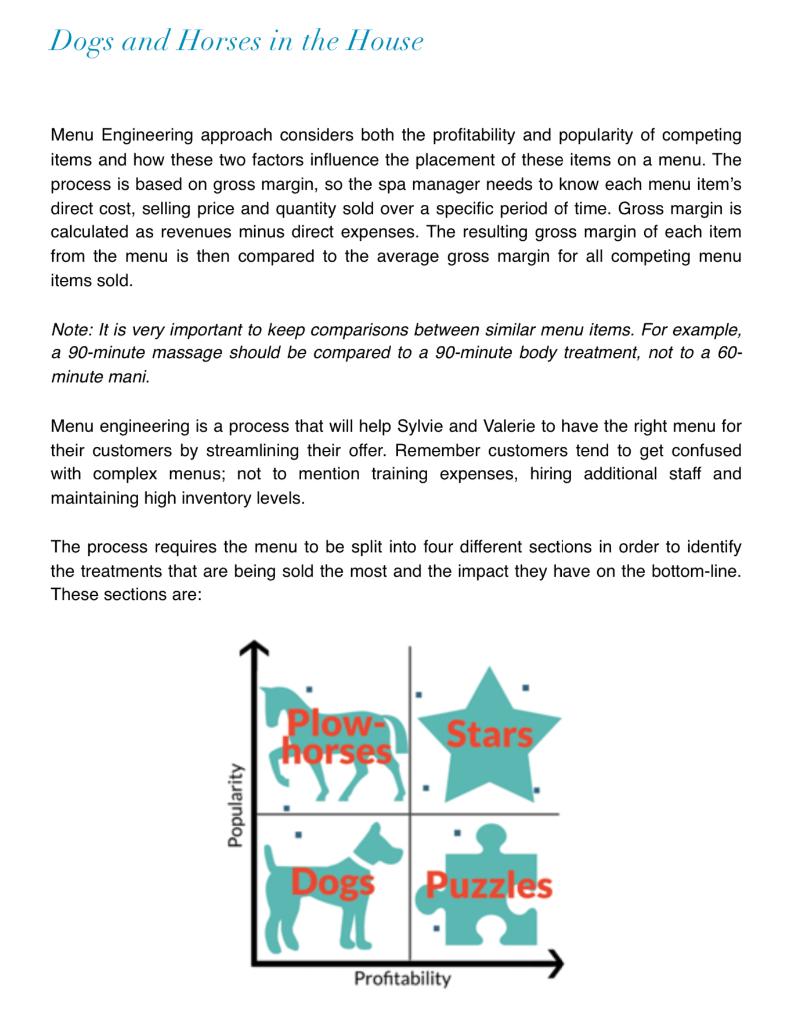
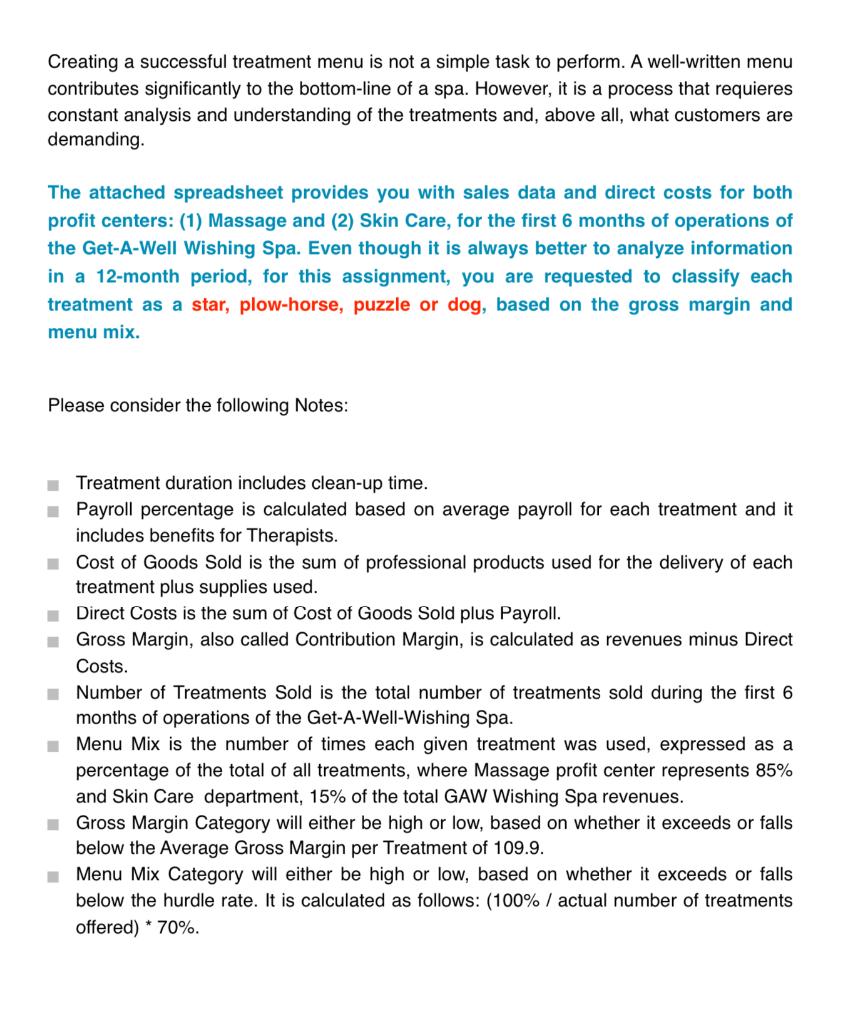
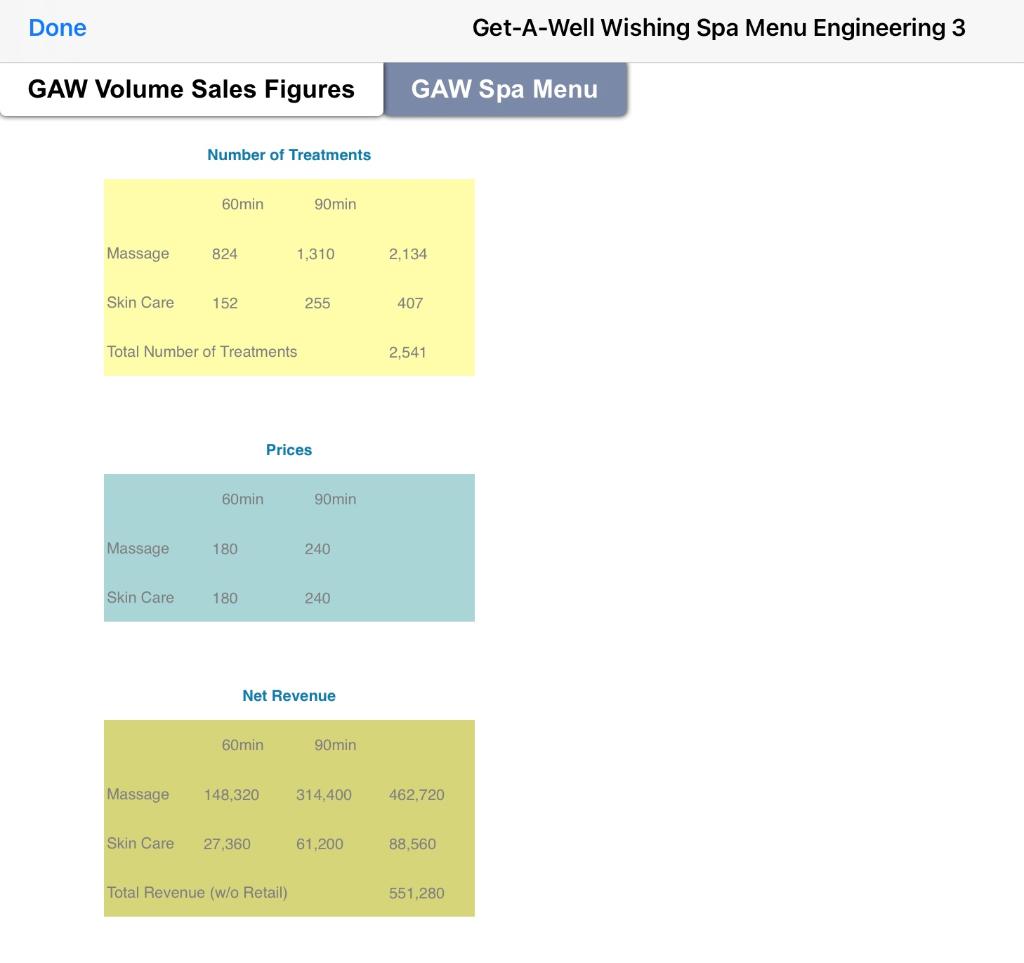
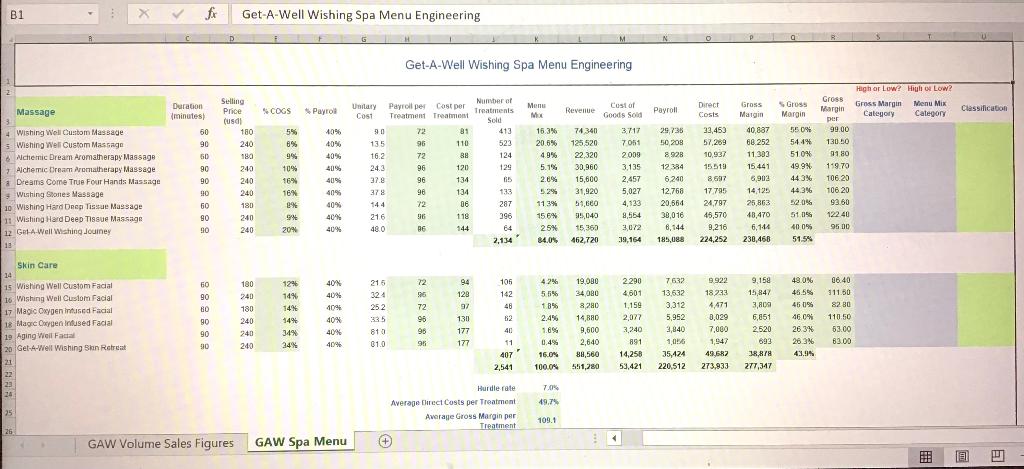
Instructions For this assignment, you are requested to classify each treatment of the Get-A-Well Wishing Spa Menu as a star, plow-horse, puzzle or dog, based on the gross margin and menu mix. Please refer to the Get-A-Well Wishing Spa Menu Engineering Model. Instructions are found in the following document: Dogs and Horses in the House! Your assignment should be uploaded by Sunday at 11:55pm PST. Dogs and Horses in the House Menu Engineering approach considers both the profitability and popularity of competing items and how these two factors influence the placement of these items on a menu. The process is based on gross margin, so the spa manager needs to know each menu item's direct cost, selling price and quantity sold over a specific period of time. Gross margin is calculated as revenues minus direct expenses. The resulting gross margin of each item from the menu is then compared to the average gross margin for all competing menu items sold. Note: It is very important to keep comparisons between similar menu items. For example, a 90-minute massage should be compared to a 90-minute body treatment, not to a 60- minute mani. Menu engineering is a process that will help Sylvie and Valerie to have the right menu for their customers by streamlining their offer. Remember customers tend to get confused with complex menus; not to mention training expenses, hiring additional staff and maintaining high inventory levels. The process requires the menu to be split into four different sections in order to identify the treatments that are being sold the most and the impact they have on the bottom-line. These sections are: Plow horses Stars Popularity Dogs Puzzles Profitability Creating a successful treatment menu is not a simple task to perform. A well-written menu contributes significantly to the bottom-line of a spa. However, it is a process that requieres constant analysis and understanding of the treatments and, above all, what customers are demanding. The attached spreadsheet provides you with sales data and direct costs for both profit centers: (1) Massage and (2) Skin Care, for the first 6 months of operations of the Get-A-Well Wishing Spa. Even though it is always better to analyze information in a 12-month period, for this assignment, you are requested to classify each treatment as a star, plow-horse, puzzle or dog, based on the gross margin and menu mix. Please consider the following Notes: Treatment duration includes clean-up time. Payroll percentage is calculated based on average payroll for each treatment and it includes benefits for Therapists. Cost of Goods Sold is the sum of professional products used for the delivery of each treatment plus supplies used. Direct Costs is the sum of Cost of Goods Sold plus Payroll. Gross Margin, also called Contribution Margin, is calculated as revenues minus Direct Costs. Number of Treatments Sold is the total number of treatments sold during the first 6 months of operations of the Get-A-Well-Wishing Spa. Menu Mix is the number of times each given treatment was used, expressed as a percentage of the total of all treatments, where Massage profit center represents 85% and Skin Care department, 15% of the total GAW Wishing Spa revenues. Gross Margin Category will either be high or low, based on whether it exceeds or falls below the Average Gross Margin per Treatment of 109.9. Menu Mix Category will either be high low, based whether it exceeds or falls below the hurdle rate. It is calculated as follows: (100% / actual number of treatments offered) * 70%. Done Get-A-Well Wishing Spa Menu Engineering 3 GAW Volume Sales Figures GAW Spa Menu Number of Treatments 60min 90min Massage 824 1,310 2.134 Skin Care 152 255 407 Total Number of Treatments 2,541 Prices 60min 90min Massage 180 240 Skin Care 180 240 Net Revenue 60min 90min Massage 148,320 314,400 462.720 Skin Care 27,360 61,200 88,560 Total Revenue (w/o Retail) 551,280 B1 Get-A-Well Wishing Spa Menu Engineering M 0 Pa Get-A-Well Wishing Spa Menu Engineering Duration minutes) Massage COGS High or Low? High of Low? Gross Margin Menu Mix Category Category Menu Mix Payroll Cost of Goods Soul Revenue Direct Costs Payroll Classification Selling Price (usal 180 240 Number of Treatments Sold 413 523 124 55 60 90 50 90 6% Gross Margin per 99.00 130.50 91 80 119.70 99 190 240 40% 40% 40% 40% 409 40% 4 Wishing Well Custom Massage 5 Wishing Well Custom Massage Nchemic Dream Aromatherapy Massage Alchemic Dream Aromatherapy Massage a Dreams Come True Four Hands Massage Wishing Stones Massage 20 Wishing Hard Deep Tissue Massage 1. Wishing Hard Deep Tissue Massage 12 GRI-A-Well Wishing Journey Unitary Payroll per Cost per C051 Treatment Treatment 90 72 81 135 96 110 16.2 72 88 243 96 120 37.8 96 134 378 98 134 144 72 06 216 916 118 480 26 144 129 10% 16% 168 2% 99 90 16.3% 20.6% % 4.9% 5.1% 2.8% 5.2% 11.3% 15.6 25% 84.0% 74340 125,520 22,320 30,960 15,600 31,920 51,680 95,040 15,364 462,720 3717 7051 2009 3.135 2.457 5,027 4.123 8,554 3,072 39,164 240 240 180 240 240 Gross Margir 40,887 68.252 11303 15.441 5,902 14.125 25,863 48,470 6,144 230,468 29.735 50 208 8928 12,384 6.240 12.768 20,564 38,016 8,144 185.088 Gross Margin 55.0% 5449 5109 49.9% 4436 44.3% 52.0% 51.055 40.0% 51.54 33,453 57,259 10,937 15518 8 697 17.795 24,797 45,570 9,216 224,252 90 60 409 40% 40% 90 90 106.20 10620 93.60 122.40 95 00 133 287 398 64 2,134 200 9.159 60 40% 72 180 240 94 128 92 40% 180 Skin Care 14 15 Wishing Well Custom Facial 16 Wishing Well Custom Facial 17 Magic Oxygen intused Facial 18 Magic Oxygen Infused Facial 19 Aging Well Faca 20 Gel-A-Well Wishing Skin Retreat 21 90 BO 90 90 129 14% 14% 14% 34% 34% 409 40% 215 324 252 335 810 01.0 72 96 98 95 240 105 142 48 62 401 11 407 2,541 130 177 4.2% 5.5% 18% 2.4% 1.6% 0.4% 16.0% 100.0% 19.080 34,080 8280 14,880 9,500 2,640 89,560 551,280 2290 4601 1.159 2,077 3,240 891 14,258 59.421 7682 13.632 3,312 5,952 3,840 1056 35,124 220,512 9.922 18 233 4,471 0,029 7.000 1947 49.6R2 273,933 49.0% 45.5% 45 0% 46.09 26.3% 26.3% 43.9% 06.40 911 50 82 30 110.50 63.00 83.00 15,847 3,ADA 6,851 2520 892 3RRR 277,347 240 240 40% 40% 90 177 7.0% 24 49.79 25 Hurdle rate Average Direct Costs per Treatment Average Gross Margin per Treatment (+ 109.1 26 GAW Volume Sales Figures GAW Spa Menu Instructions For this assignment, you are requested to classify each treatment of the Get-A-Well Wishing Spa Menu as a star, plow-horse, puzzle or dog, based on the gross margin and menu mix. Please refer to the Get-A-Well Wishing Spa Menu Engineering Model. Instructions are found in the following document: Dogs and Horses in the House! Your assignment should be uploaded by Sunday at 11:55pm PST. Dogs and Horses in the House Menu Engineering approach considers both the profitability and popularity of competing items and how these two factors influence the placement of these items on a menu. The process is based on gross margin, so the spa manager needs to know each menu item's direct cost, selling price and quantity sold over a specific period of time. Gross margin is calculated as revenues minus direct expenses. The resulting gross margin of each item from the menu is then compared to the average gross margin for all competing menu items sold. Note: It is very important to keep comparisons between similar menu items. For example, a 90-minute massage should be compared to a 90-minute body treatment, not to a 60- minute mani. Menu engineering is a process that will help Sylvie and Valerie to have the right menu for their customers by streamlining their offer. Remember customers tend to get confused with complex menus; not to mention training expenses, hiring additional staff and maintaining high inventory levels. The process requires the menu to be split into four different sections in order to identify the treatments that are being sold the most and the impact they have on the bottom-line. These sections are: Plow horses Stars Popularity Dogs Puzzles Profitability Creating a successful treatment menu is not a simple task to perform. A well-written menu contributes significantly to the bottom-line of a spa. However, it is a process that requieres constant analysis and understanding of the treatments and, above all, what customers are demanding. The attached spreadsheet provides you with sales data and direct costs for both profit centers: (1) Massage and (2) Skin Care, for the first 6 months of operations of the Get-A-Well Wishing Spa. Even though it is always better to analyze information in a 12-month period, for this assignment, you are requested to classify each treatment as a star, plow-horse, puzzle or dog, based on the gross margin and menu mix. Please consider the following Notes: Treatment duration includes clean-up time. Payroll percentage is calculated based on average payroll for each treatment and it includes benefits for Therapists. Cost of Goods Sold is the sum of professional products used for the delivery of each treatment plus supplies used. Direct Costs is the sum of Cost of Goods Sold plus Payroll. Gross Margin, also called Contribution Margin, is calculated as revenues minus Direct Costs. Number of Treatments Sold is the total number of treatments sold during the first 6 months of operations of the Get-A-Well-Wishing Spa. Menu Mix is the number of times each given treatment was used, expressed as a percentage of the total of all treatments, where Massage profit center represents 85% and Skin Care department, 15% of the total GAW Wishing Spa revenues. Gross Margin Category will either be high or low, based on whether it exceeds or falls below the Average Gross Margin per Treatment of 109.9. Menu Mix Category will either be high low, based whether it exceeds or falls below the hurdle rate. It is calculated as follows: (100% / actual number of treatments offered) * 70%. Done Get-A-Well Wishing Spa Menu Engineering 3 GAW Volume Sales Figures GAW Spa Menu Number of Treatments 60min 90min Massage 824 1,310 2.134 Skin Care 152 255 407 Total Number of Treatments 2,541 Prices 60min 90min Massage 180 240 Skin Care 180 240 Net Revenue 60min 90min Massage 148,320 314,400 462.720 Skin Care 27,360 61,200 88,560 Total Revenue (w/o Retail) 551,280 B1 Get-A-Well Wishing Spa Menu Engineering M 0 Pa Get-A-Well Wishing Spa Menu Engineering Duration minutes) Massage COGS High or Low? High of Low? Gross Margin Menu Mix Category Category Menu Mix Payroll Cost of Goods Soul Revenue Direct Costs Payroll Classification Selling Price (usal 180 240 Number of Treatments Sold 413 523 124 55 60 90 50 90 6% Gross Margin per 99.00 130.50 91 80 119.70 99 190 240 40% 40% 40% 40% 409 40% 4 Wishing Well Custom Massage 5 Wishing Well Custom Massage Nchemic Dream Aromatherapy Massage Alchemic Dream Aromatherapy Massage a Dreams Come True Four Hands Massage Wishing Stones Massage 20 Wishing Hard Deep Tissue Massage 1. Wishing Hard Deep Tissue Massage 12 GRI-A-Well Wishing Journey Unitary Payroll per Cost per C051 Treatment Treatment 90 72 81 135 96 110 16.2 72 88 243 96 120 37.8 96 134 378 98 134 144 72 06 216 916 118 480 26 144 129 10% 16% 168 2% 99 90 16.3% 20.6% % 4.9% 5.1% 2.8% 5.2% 11.3% 15.6 25% 84.0% 74340 125,520 22,320 30,960 15,600 31,920 51,680 95,040 15,364 462,720 3717 7051 2009 3.135 2.457 5,027 4.123 8,554 3,072 39,164 240 240 180 240 240 Gross Margir 40,887 68.252 11303 15.441 5,902 14.125 25,863 48,470 6,144 230,468 29.735 50 208 8928 12,384 6.240 12.768 20,564 38,016 8,144 185.088 Gross Margin 55.0% 5449 5109 49.9% 4436 44.3% 52.0% 51.055 40.0% 51.54 33,453 57,259 10,937 15518 8 697 17.795 24,797 45,570 9,216 224,252 90 60 409 40% 40% 90 90 106.20 10620 93.60 122.40 95 00 133 287 398 64 2,134 200 9.159 60 40% 72 180 240 94 128 92 40% 180 Skin Care 14 15 Wishing Well Custom Facial 16 Wishing Well Custom Facial 17 Magic Oxygen intused Facial 18 Magic Oxygen Infused Facial 19 Aging Well Faca 20 Gel-A-Well Wishing Skin Retreat 21 90 BO 90 90 129 14% 14% 14% 34% 34% 409 40% 215 324 252 335 810 01.0 72 96 98 95 240 105 142 48 62 401 11 407 2,541 130 177 4.2% 5.5% 18% 2.4% 1.6% 0.4% 16.0% 100.0% 19.080 34,080 8280 14,880 9,500 2,640 89,560 551,280 2290 4601 1.159 2,077 3,240 891 14,258 59.421 7682 13.632 3,312 5,952 3,840 1056 35,124 220,512 9.922 18 233 4,471 0,029 7.000 1947 49.6R2 273,933 49.0% 45.5% 45 0% 46.09 26.3% 26.3% 43.9% 06.40 911 50 82 30 110.50 63.00 83.00 15,847 3,ADA 6,851 2520 892 3RRR 277,347 240 240 40% 40% 90 177 7.0% 24 49.79 25 Hurdle rate Average Direct Costs per Treatment Average Gross Margin per Treatment (+ 109.1 26 GAW Volume Sales Figures GAW Spa Menu
Step by Step Solution
There are 3 Steps involved in it

Get step-by-step solutions from verified subject matter experts