

Question: Instructions In this exercise you will explore gapminder dataset from library ( gapminder ) to help people understand some basic global facts. Your work is
Instructions
In this exercise you will explore gapminder dataset from library gapminder to help people understand some basic global facts. Your work is to provide answers to questions by exploring the gapminder dataset. Specific instructionssteps are listed in the 'Tasks' section. Follow the steps below to get started.
Use library tidyverse; library gapminder to load the necessary packages. Check the dataset information using gapminder.
Use filter to remove data of country "Kuwait" from the gapminder dataset for reasons noted in the background.
Now you can play with the data to find the answers of the questions.
Questions
Q What are the top three countries with the highest life expectancy at birth in and
Q How many countries had life expectancy at birth smaller than in and
Q What are total population in and in Asia?
Q How many countries had population higher than in and
Q What are the top five countries with the highest total GDP pop gdpPercap in and
Q What are the mean values of lifeExp and gdpPercap in and for Africa?
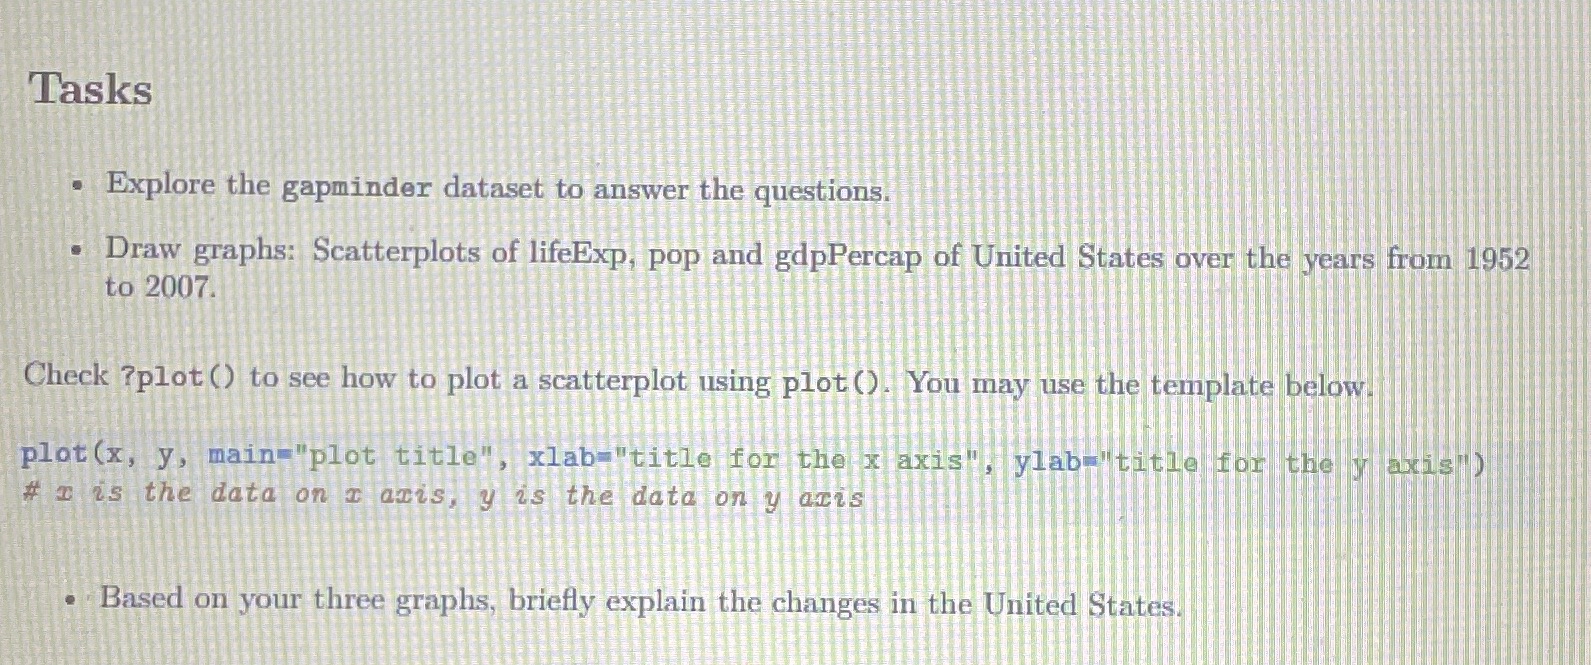
Tasks
Explore the gapminder dataset to answer the questions.
Draw graphs: Scatterplots of lifeExp, pop and gdpPercap of United States over the years from to
Check?plot to see how to plot a scatterplot using plot You may use the template below.
plotx y main"plot title", xlab"title for the x axis", ylab"title for the y axis"
# is the data on axis, is the data on axis
Based on your three graphs, briefly explain the changes in the United States.
Step by Step Solution
There are 3 Steps involved in it
1 Expert Approved Answer
Step: 1 Unlock

To tackle this exercise follow these steps using R and the gapminder and tidyverse libraries Step 1 Load the Necessary Libraries R librarytidyverse li... View full answer
Question Has Been Solved by an Expert!
Get step-by-step solutions from verified subject matter experts
Step: 2 Unlock
Step: 3 Unlock