

Question: Instructions Individual Assignment #1 Used the data provided in the attached spreadsheet under the name Chapter01Thunderhead for the following exercises: 1.Calculate 2021 forecasts for Thunderhead


Instructions
Individual Assignment #1
Used the data provided in the attached spreadsheet under the name "Chapter01Thunderhead" for the following exercises:
1.Calculate 2021 forecasts for Thunderhead using a 5 -year, 4-year, and 3-year moving average.
2.Use regression analysis and the sales figures through 2020 to estimate a trend and forecast for 2021.
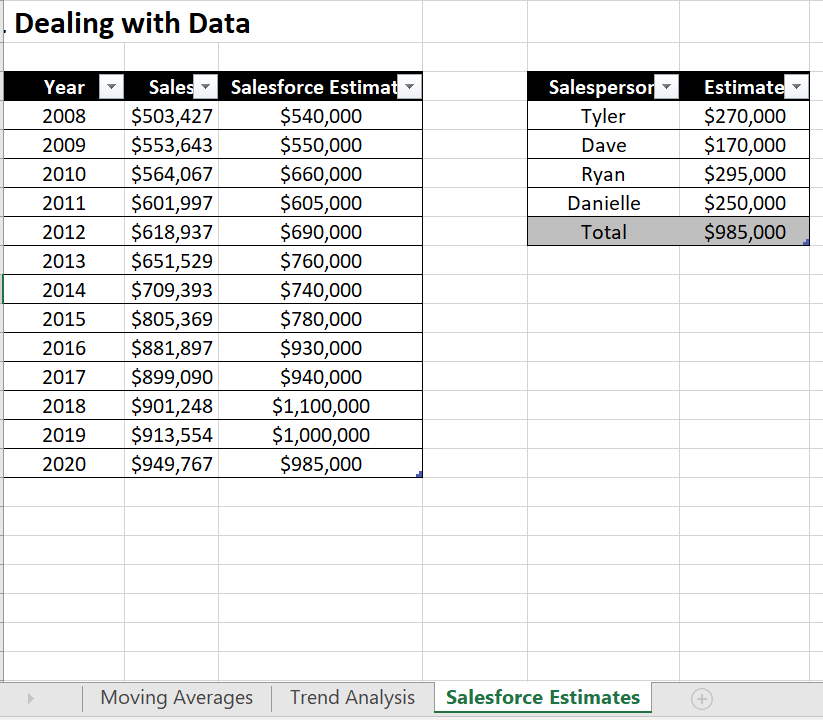
3.Using the data provided by the salespeople and the historical sales data, calculate the average ratio of sales to salesforce estimate (Hint: Also called the percentage of accuracy of the salesforce's projected sales).
4.Calculate the 2021 sales estimate based on the input of the four salespeople.
5.Based on all the forecasts you obtained, which do you think should the manger use?, why? (Your opinion).
NOTE: Submit a word document with all the answers, along with the excel file that includes the process you followed to get the answers.
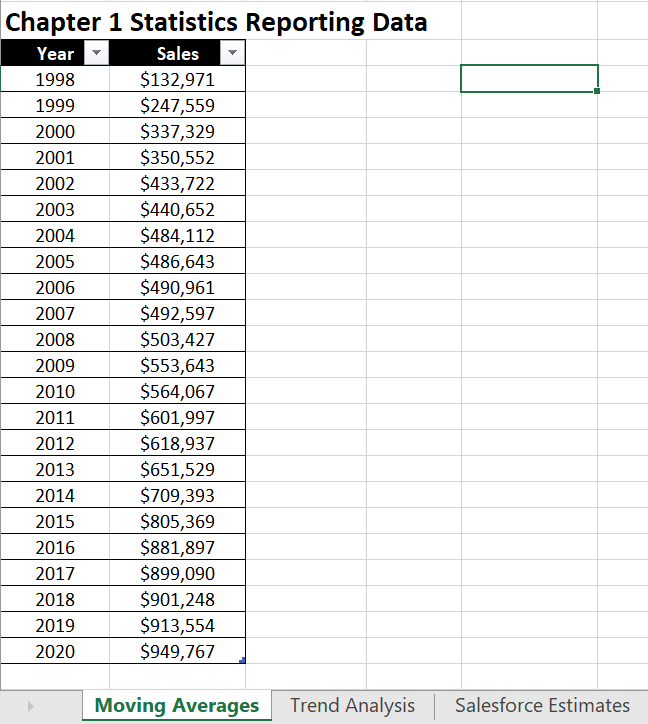
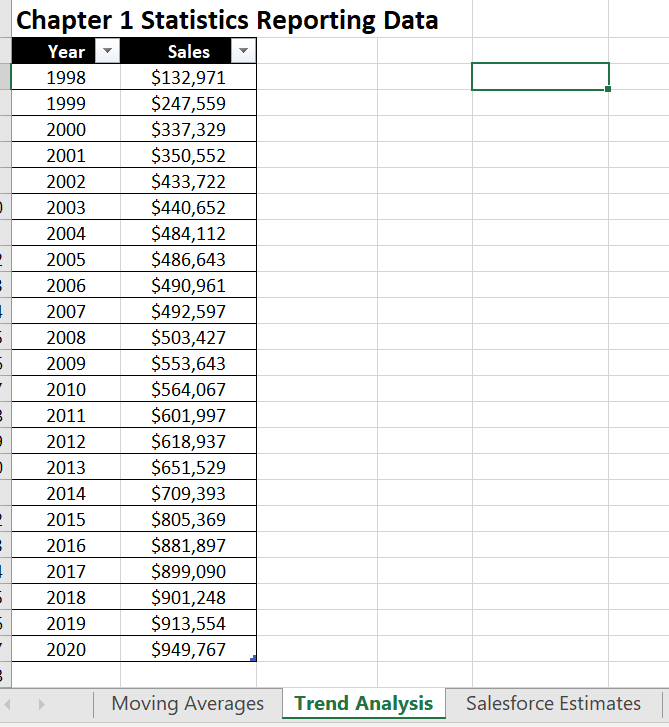
Chapter 1 Statistics Reporting Data Year l Sales 1998 $132,971 | _| 1999 $247,559 2000 $337,329 2001 $350,552 2002 $433,722 2003 $440,652 2004 $484,112 2005 $486,643 2006 $490,961 2007 $492,597 2008 $503,427 2009 $553,643 2010 $564,067 2011 $601,997 2012 $618,937 2013 $651,529 2014 $709,393 2015 $805,369 2016 $881,897 2017 $899,090 2018 $901,248 2019 $913,554 2020 $949,767 l Moving Averages Trend Analysis | Salesforce Estimates Chapter 1 Statistics Reporting Data Year Sales 1998 $132,971 1999 $247,559 2000 $337,329 2001 $350,552 2002 $433,722 2003 $440,652 2004 $484,112 2005 $486,643 2006 $490,961 2007 $492,597 2008 $503,427 2009 $553,643 2010 $564,067 2011 $601,997 2012 $618,937 2013 $651,529 2014 $709,393 2015 $805,369 2016 $881,897 2017 $899,090 2018 $901,248 2019 $913,554 2020 $949,767 Moving Averages Trend Analysis Salesforce Estimates
Step by Step Solution
There are 3 Steps involved in it

Get step-by-step solutions from verified subject matter experts