

Question: Instructions Let's continue to explore how we can focus attention and apply some of the learnings from class. When we visualize data, there are often
Instructions Let's continue to explore how we can focus attention and apply some of the learnings from class. When we visualize data, there are often various takeaways that we could highlight. It can sometimes be useful to show the same graph multiple times, each instance highlighting the point or points we want to focus on as we walk our audience through different nuances of the data. This allows them to know exactly where to look in the data as we are talking, or when they are reading corresponding text. See the following visual, which shows year-over-year change ("YoY, measured as percent change in dollar sales volume) for cat food brands from a pet food manufacturer. The output/solution should be an explanation of what you are doing and a graph for each question.
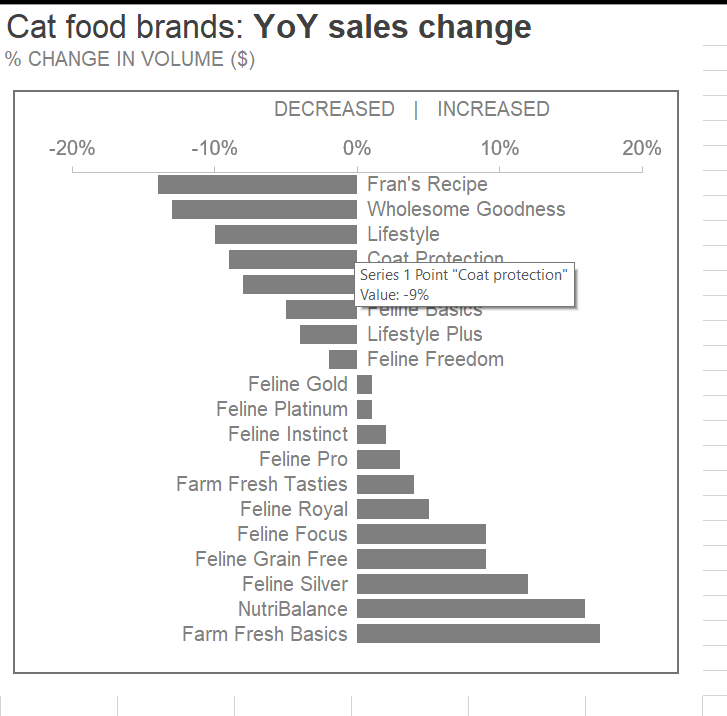
Let's say you will be presenting this data live and want to begin by talking about the Lifestyle brand line: Lifestyle, Diet Lifestyle, and Lifestyle Plus. How would you visually indicate to your audience to look at those points of data?
Assume you next want to talk about the Feline brand group, which includes all of the brands with "Feline" in their name. The branding for this line of cat food has a purple logo. How would you indicate to your audience that they should focus here?
Next, you want to discuss the brands that had year-over-year declines. How could you draw your audience's attention there?
Let's imagine that within the declining brands, you want to talk specifically about the two brands that declined the most: Fran's Recipe and Wholesome Goodness. How might you achieve this?
Assume you want to talk about the brands that had year-over-year increases in sales. How would you draw your audience's attention there? What is similar to how you directed attention to the decreasing brands? Would you do anything different in comparison?
You want to create a final comprehensive view to be distributed that highlights each of the takeaways outlined previously: Lifestyle brands, Feline brands, decreasing brands (differentiating those decreasing most), and increasing brands (highlighting those that increased most). How would you achieve this? How would you pair this with explanatory text and make it clear how the text relates to the data?
I'm not able to figure out how to work on this problem. Can anyone help me to complete these set of questions.
Cat food brands: YoY sales change % CHANGE IN VOLUME ($) DECREASED INCREASED -20% 20% -10% 0% 10% Fran's Recipe Wholesome Goodness Lifestyle Coat Protection Series 1 Point "Coat protection" Value: -9% Teme Dasics Lifestyle Plus Feline Freedom Feline Gold Feline Platinum Feline Instinct Feline Pro Farm Fresh Tasties Feline Royal Feline Focus Feline Grain Free Feline Silver NutriBalance Farm Fresh BasicsStep by Step Solution
There are 3 Steps involved in it

Get step-by-step solutions from verified subject matter experts