

Question: Instructions Open up the Excel spreadsheet attached. 1. Run a regression with gender as your predictor variable and wage as a response variable a. Interpret
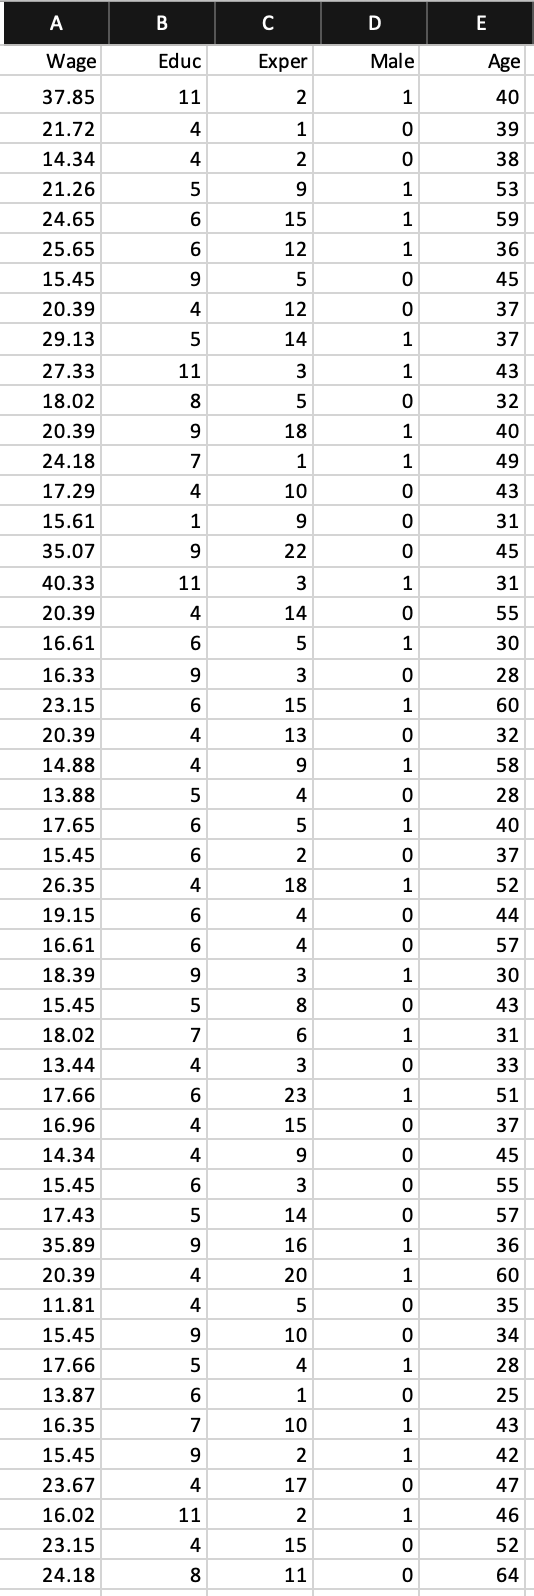
Instructions Open up the Excel spreadsheet attached. 1. Run a regression with gender as your predictor variable and wage as a response variable a. Interpret the results (What percent of the movement of wage is created by gender, is the model statistically significant at the 5% level, are the parts statistically significant.) b. Do males make more than females holding everything else constant? 2. Run a regression with gender and age as the predictor variable and wage as the response variable. a. Interpret the results. (Same as above, also, which model is better) 3. Run a regression with gender, education and experience as the predictor variables and wage as the response variable a. Interpret the results. (same as you did for the above models. Also, which of the three models is best. b. What happened to gender? Give an explanation. c. Use the third model to predict the wage of a female with 11 years of experience and 6 years of higher education (bachelors and MBA). Compare that to a males with the same qualifications. (Male, 11 yrs of experience and 6 yrs of higher education) Stats Final.xlsx (9.31 KB) A B C D E Wage Educ Exper Male Age 11 2 1 40 39 4 1 4 ONE 2 0 38 5 9 1 53 37.85 21.72 14.34 21.26 24.65 25.65 15.45 20.39 29.13 15 1 59 36 6 12 1 9 B 25 24 0 45 4 12 0 37 37 5 14 o o o o o o o o 11 3 27.33 18.02 uu 43 32 8 5 0 9 18 40 7 1 1 49 20.39 24.18 17.29 15.61 35.07 0 0 0 4 10 43 1 9 31 22 9 22 0 45 40.33 11 1 31 55 4 14 6 5 1 30 wa w u w 9 28 6 15 1 60 4 20.39 16.61 16.33 23.15 20.39 14.88 13.88 17.65 15.45 26.35 13 9 32 58 4 O O O O O O O P 1 5 4 28 6 5 1 40 6 2 37 4 18 1 52 6 4 44 4 57 30 9 3 1 5 8 43 7 6 1 31 19.15 16.61 18.39 15.45 18.02 13.44 17.66 16.96 14.34 15.45 4 3 33 51 6 23 1 4 15 37 4 9 45 6 55 5 3 14 16 17.43 35.89 20.39 57 9 1 36 4 20 HOO o o o o o o o HH OH OO 1 60 4 5 11.81 15.45 9 10 35 34 28 25 Do u 5 4 1 17.66 13.87 16.35 6 1 0 7 10 1 43 9 1 42 2 17 4 47 15.45 23.67 16.02 23.15 24.18 11 2 1 46 4 15 0 52 8 11 0 64 Instructions Open up the Excel spreadsheet attached. 1. Run a regression with gender as your predictor variable and wage as a response variable a. Interpret the results (What percent of the movement of wage is created by gender, is the model statistically significant at the 5% level, are the parts statistically significant.) b. Do males make more than females holding everything else constant? 2. Run a regression with gender and age as the predictor variable and wage as the response variable. a. Interpret the results. (Same as above, also, which model is better) 3. Run a regression with gender, education and experience as the predictor variables and wage as the response variable a. Interpret the results. (same as you did for the above models. Also, which of the three models is best. b. What happened to gender? Give an explanation. c. Use the third model to predict the wage of a female with 11 years of experience and 6 years of higher education (bachelors and MBA). Compare that to a males with the same qualifications. (Male, 11 yrs of experience and 6 yrs of higher education) Stats Final.xlsx (9.31 KB) A B C D E Wage Educ Exper Male Age 11 2 1 40 39 4 1 4 ONE 2 0 38 5 9 1 53 37.85 21.72 14.34 21.26 24.65 25.65 15.45 20.39 29.13 15 1 59 36 6 12 1 9 B 25 24 0 45 4 12 0 37 37 5 14 o o o o o o o o 11 3 27.33 18.02 uu 43 32 8 5 0 9 18 40 7 1 1 49 20.39 24.18 17.29 15.61 35.07 0 0 0 4 10 43 1 9 31 22 9 22 0 45 40.33 11 1 31 55 4 14 6 5 1 30 wa w u w 9 28 6 15 1 60 4 20.39 16.61 16.33 23.15 20.39 14.88 13.88 17.65 15.45 26.35 13 9 32 58 4 O O O O O O O P 1 5 4 28 6 5 1 40 6 2 37 4 18 1 52 6 4 44 4 57 30 9 3 1 5 8 43 7 6 1 31 19.15 16.61 18.39 15.45 18.02 13.44 17.66 16.96 14.34 15.45 4 3 33 51 6 23 1 4 15 37 4 9 45 6 55 5 3 14 16 17.43 35.89 20.39 57 9 1 36 4 20 HOO o o o o o o o HH OH OO 1 60 4 5 11.81 15.45 9 10 35 34 28 25 Do u 5 4 1 17.66 13.87 16.35 6 1 0 7 10 1 43 9 1 42 2 17 4 47 15.45 23.67 16.02 23.15 24.18 11 2 1 46 4 15 0 52 8 11 0 64
Step by Step Solution
There are 3 Steps involved in it

Get step-by-step solutions from verified subject matter experts