

Question: Instructions: Please answer the following question showing all your work details. Please upload the answers in Canvas, including your responses, detailed calculations and Excel file
Instructions: Please answer the following question showing all your work details. Please upload the answers in Canvas, including your responses, detailed calculations and Excel file with clear illustrations of works. Bare in mind how you present your results and answers. Q1. Why should an organization not rely only on ROI to select projects? [3 points] Q2. Two new software projects are proposed to a start-up company. Project Y will cost $150,000 to develop and is expected to have an annual net cash flow of $40,000. On the other hand, Project X will cost $200,000 to develop and is expected to have an annual net cash flow of $50,000. The company is very concerned about its cash flow. Using the payback period, which project is better from a cash flow standpoint? Why? [2 marks] Q3. A five-year project has a projected net cash flow of $15,000, $25,000, $30,000, $20,000, and $15,000 in the next five years. It will cost $50,000 to implement the project. If the required rate of return (ROR) is 20 percent, conduct a discounted cash flow calculation to determine the NPV using both manual calculation and MS Excel. [5 marks] Q.4 You work for a company which expects to earn at least 18 percent on its investments. You have to choose between two similar projects. Your analysts predict that inflation rate will be a stable 3 percent over the next 7 years. Below is the cash flow information for each project. Which of the two projects would you fund if the decision is based only on financial information? Why? [5 marks]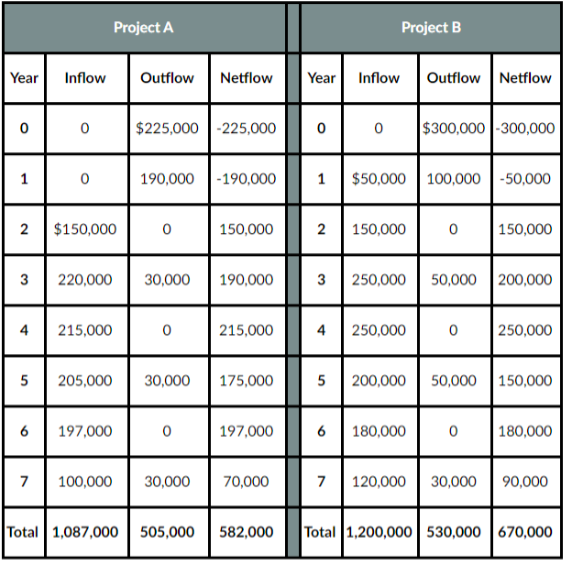
\begin{tabular}{|c|c|c|c|c|c|c|c|} \hline \multicolumn{4}{|c|}{ Project A } & \multicolumn{5}{c|}{ Project B } \\ \hline Year & Inflow & Outflow & Netflow & Year & Inflow & Outflow & Netflow \\ \hline 0 & 0 & $225,000 & 225,000 & 0 & 0 & $300,000 & 300,000 \\ \hline 1 & 0 & 190,000 & 190,000 & 1 & $50,000 & 100,000 & 50,000 \\ \hline 2 & $150,000 & 0 & 150,000 & 2 & 150,000 & 0 & 150,000 \\ \hline 3 & 220,000 & 30,000 & 190,000 & 3 & 250,000 & 50,000 & 200,000 \\ \hline 4 & 215,000 & 0 & 215,000 & 4 & 250,000 & 0 & 250,000 \\ \hline 5 & 205,000 & 30,000 & 175,000 & 5 & 200,000 & 50,000 & 150,000 \\ \hline 6 & 197,000 & 0 & 197,000 & 6 & 180,000 & 0 & 180,000 \\ \hline 7 & 100,000 & 30,000 & 70,000 & 7 & 120,000 & 30,000 & 90,000 \\ \hline Total & 1,087,000 & 505,000 & 582,000 & Total & 1,200,000 & 530,000 & 670,000 \\ \hline \end{tabular}
Step by Step Solution
There are 3 Steps involved in it

Get step-by-step solutions from verified subject matter experts