

Question: Instructions Please complete all problems. Unless otherwise noted, each problem is worth 5 points. To obtain full credit, you must use the methods specified in
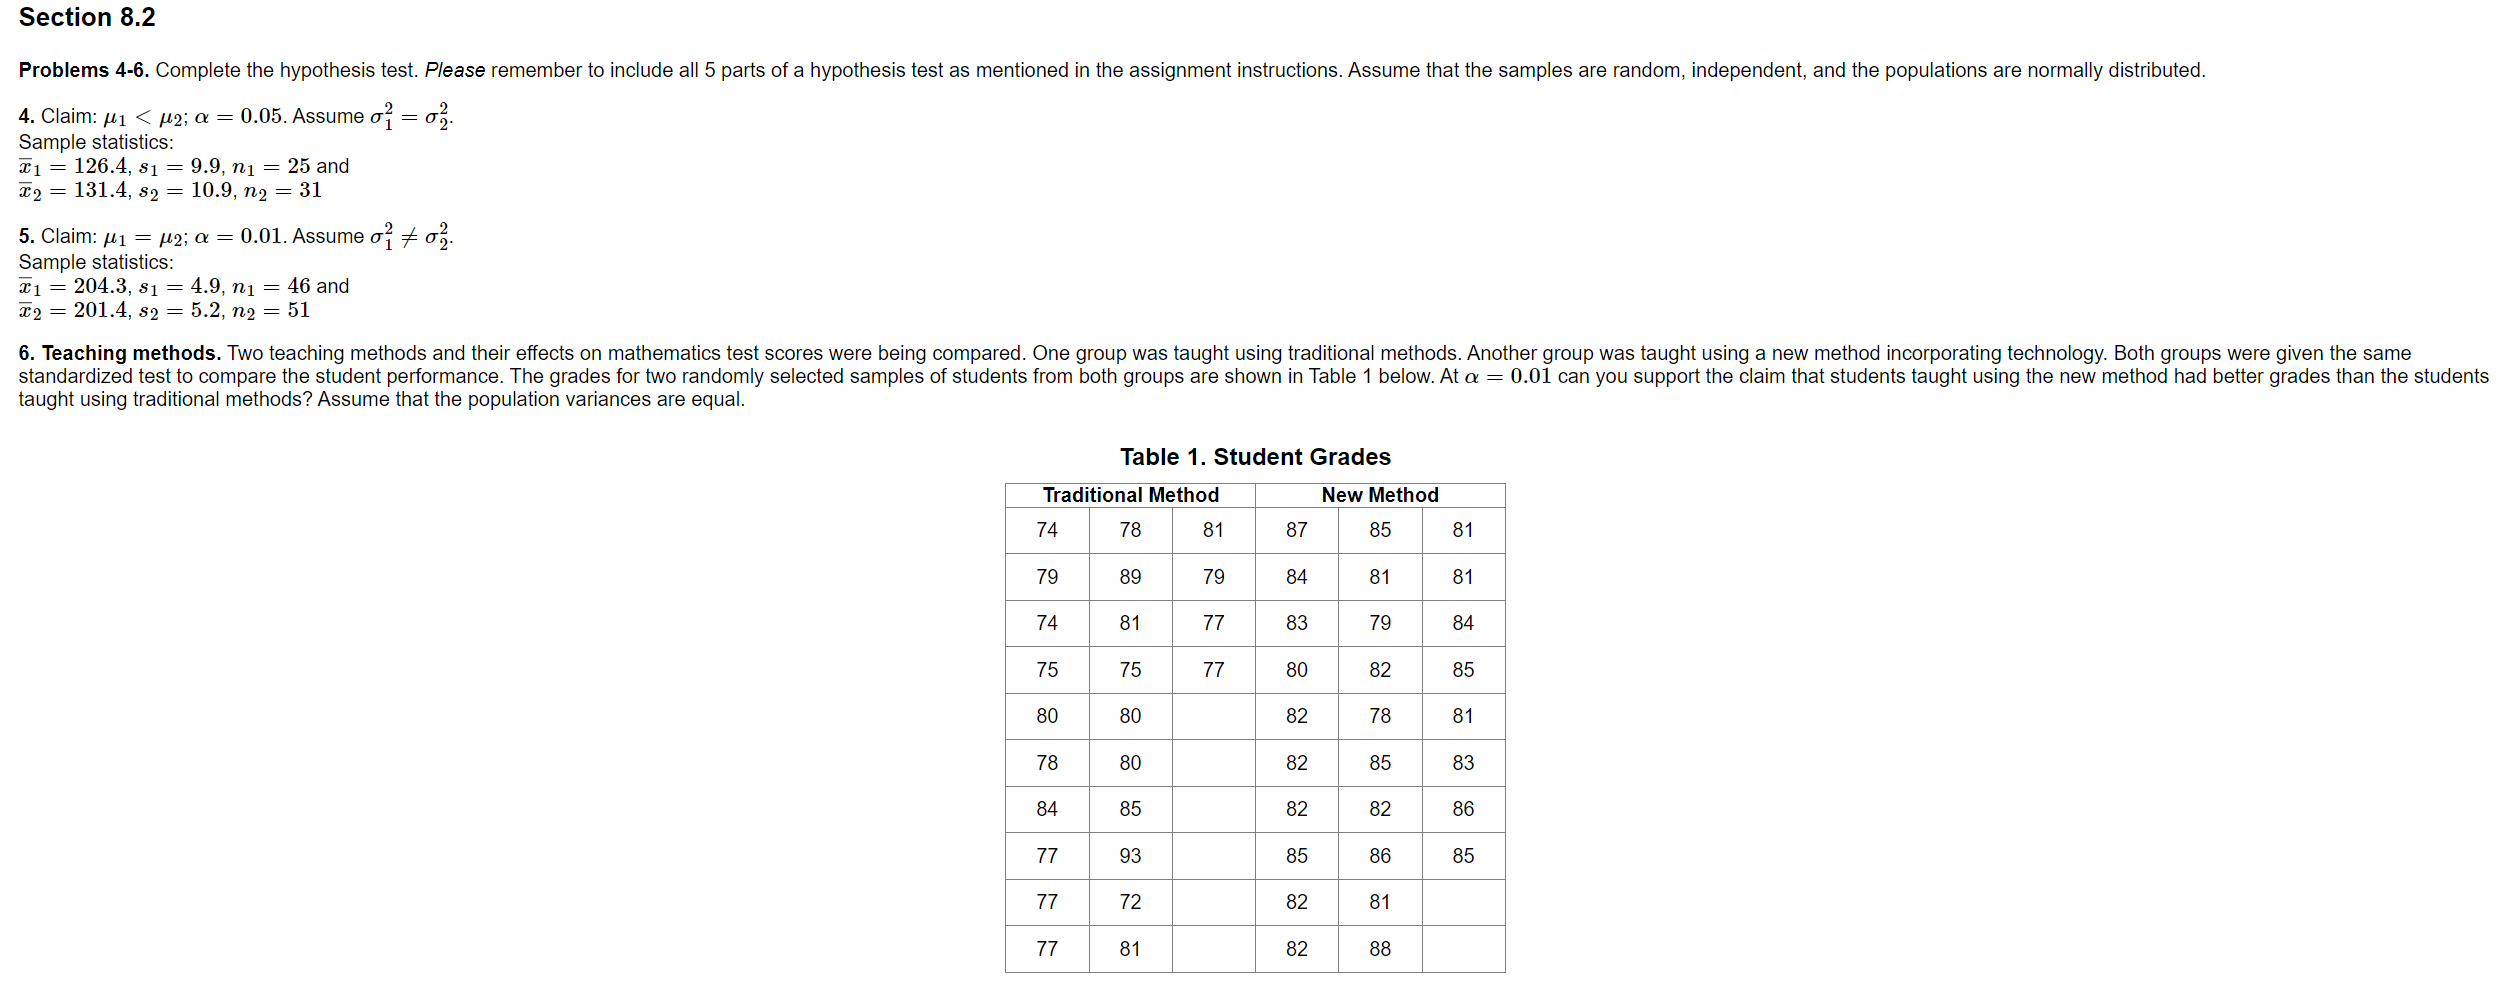
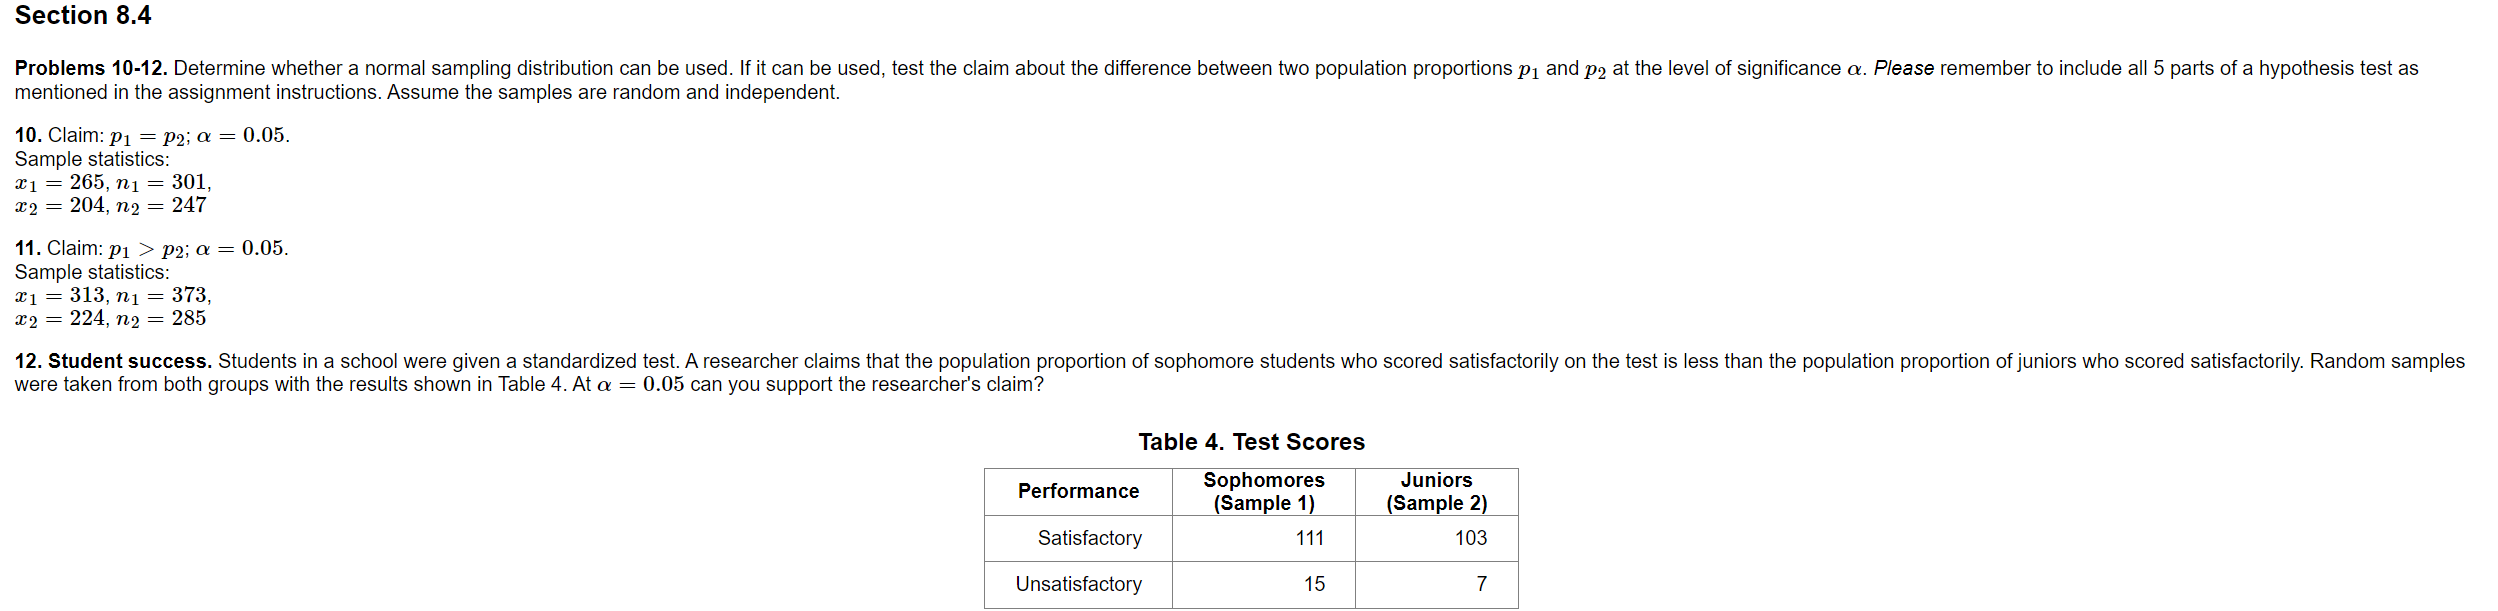
Instructions Please complete all problems. Unless otherwise noted, each problem is worth 5 points. To obtain full credit, you must use the methods specified in the course text. Please, format your work as explained in chapter 2 of the Frequently Asked Questions (FAQ) document. When doing calculations, such as the variance, standard deviation, or the correlation coefficient, use technology wherever possible. There is no need to do calculations by hand unless | direct you to do so. Rounding. You should round your z-scores to two decimal places when using a normal distribution table and the areas under the normal curve to decimal places. When using the t-distribution or doing other calculations, round to 3 decimal places unless otherwise directed. Avoid rounding until the last step of your calculations (Note: see FAQ 4.2). Testing claims. To avoid loss of points, you must include all 5 requirements listed below whenever you are asked to test a claim or conduct a hypothesis test. 1. State the null hypothesis, Ho, and the alternate hypothesis, H,, indicating which is the claim. 2. Show the calculation of the test statistic. 3. Depending on the method you use, list either (a) the p-value or (b) find the critical value(s). Note: One tail tests have only one critical value, but two tail tests have two. 4. State decision whether to reject or "fail to reject\" the null hypothesis, Ho. 5. State your conclusion about the claim. You should use the wording suggested by the author in section 7.1. Assignment Problems Section 8.1 1.Assume the hypotheses for testing the difference between the means of two different populations using two independent samples when o1 and o5 are known are: {Hn:ulm Ha:pa > po When calculating the standardized test statistic, z, what should be the assumed value of p1 pa? Problems 2-3. Complete the hypothesis test. Please remember to include all 5 parts of a hypothesis test as mentioned in the assignment instructions. Assume that the samples are random, independent, and the populations are normally distributed. 2. To compare the life time of a device manufactured by two different companies, an engineer measured the life of 34 devices from company 1 and 37 devices from company 2. For company 1 the mean life was ; = 39.4 months. Assume the population standard deviation for company 1 is 6.9 months. For company 2 the mean life was =9 = 36.3 months. Assume the population standard deviation for company 2 is 7.5 months. At & = 0.05 can the engineer support the claim that the mean life of the device is different for the two manufacturers? 3. Aresearcher compared the costs of two cars with similar features made by two manufacturers. For company 1 the mean cost for 34 cars was z; = $40, 250. Assume the population standard deviation for company 1 is $2480. For company 2 the mean cost for 37 cars was Ty = $37,450. Assume the population standard deviation for company 2 is $2960. At a = 0.01 can the researcher support the claim that the difference between the mean costs for the cars is more than $1200 for the two manufacturers? (Note: Before you attempt this problem, please review the supplementary document posted in Unit 3 of your BrightSpace course, "Testing Nonzero Differences in the Means".) Section 8.2 Problems 4-6. Complete the hypothesis test. Please remember to include all 5 parts of a hypothesis test as mentioned in the assignment instructions. Assume that the samples are random, independent, and the populations are normally distributed. 4. Claim: /1 p2; a = 0.05. Sample statistics: x1 = 313, n1 = 373, = 224, n2 = 285 12. Student success. Students in a school were given a standardized test. A researcher claims that the population proportion of sophomore students who scored satisfactorily on the test is less than the population proportion of juniors who scored satisfactorily. Random samples were taken from both groups with the results shown in Table 4. At a = 0.05 can you support the researcher's claim? Table 4. Test Scores Performance Sophomores Juniors (Sample 1) (Sample 2) Satisfactory 111 103 Unsatisfactory 15 7
Step by Step Solution
There are 3 Steps involved in it

Get step-by-step solutions from verified subject matter experts