

Question: Instructions: Please submit one selfcontained Word or PDF document that includes all of your calculations, written explanations, R scripts, and R output. You may also
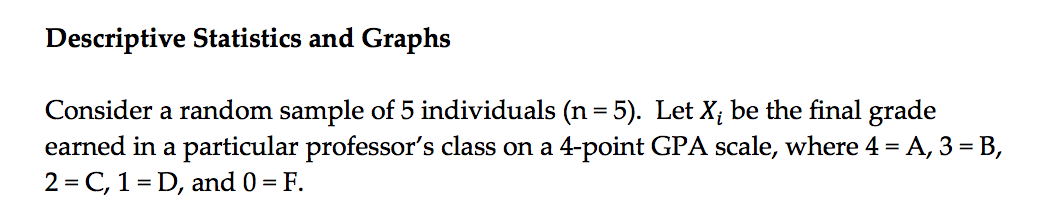
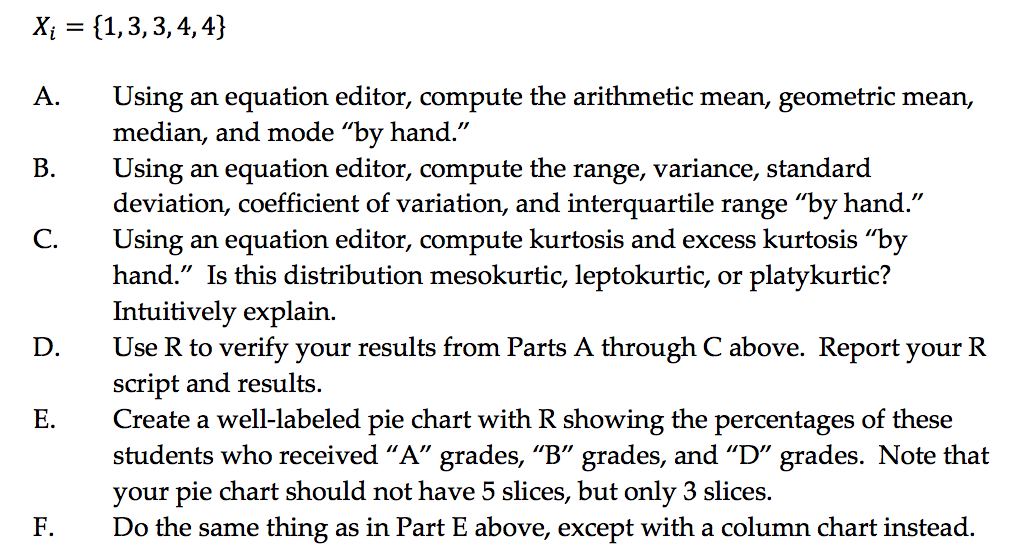
Instructions: Please submit one selfcontained Word or PDF document that includes all of your calculations, written explanations, R scripts, and R output. You may also attach supplementary les, such as the actual R script files, etc. Descriptive Statistics and Graphs Consider a random sample of 5 individuals (11 = 5). Let X1- be the final grade earned in a particular professor's class on a 4point GPA scale, where 4 = A, 3 = B, 2=C,1=D,and0=F. Xi = {1r 3: 3: 4': 4} A. B. Using an equation editor, compute the arithmetic mean, geometric mean, median, and mode "by hand.\" Using an equation editor, compute the range, variance, standard deviation, coefcient of variation, and interquartile range "by hand.\" Using an equation editor, compute kurtosis and excess kurtosis \"by hand.\" Is this distribution mesokurtic, leptokurtic, or platykurtic? Intuitively explain. Use R to verify your results from Parts A through C above. Report your R script and results. Create a welllabeled pie chart with R showing the percentages of these students who received \"A\" grades, \"B" grades, and \"D\" grades. Note that your pie chart should not have 5 slices, but only 3 slices. Do the same thing as in Part E above, except with a column chart instead
Step by Step Solution
There are 3 Steps involved in it

Get step-by-step solutions from verified subject matter experts