

Question: Instructions: Plot graph one: [A]/M (y axis) versus time/hours (x axis). Be sure to correctly label your axis with the appropriate unit. Scale your graph
![Instructions: Plot graph one: [A]/M (y axis) versus time/hours (x axis).](https://dsd5zvtm8ll6.cloudfront.net/si.experts.images/questions/2024/09/66f91cc545368_86066f91cc4e2168.jpg)
Instructions:
- Plot graph one: [A]/M (y axis) versus time/hours (x axis). Be sure to correctly label your axis with the appropriate unit. Scale your graph appropriately so takes up the enter canvas. Decide on the type of trendline that best fits the data points.
- Plot graph two: ln[A] versus time/ hours. Label and scale your graph properly. Decide on the type of trendline that best fits the data points.
- Plot graph three; 1/[A] versus time. Label and scale your graph properly. Again decide on the type of trendline that best fits the data points.
- Only the graph that appears linear should have a linear trendline along with the equation for the line and the correlation coefficient. The other two graphs should be curves with no equations or coefficients.
- From your plots determine if the reaction is first, second or third order.
- At what time will the concentration of A be 0.380 M? Show all your work.
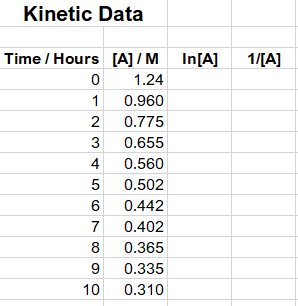
Time / hours [A] /M 0 1.24 1 0.960 2 0.775 3 0.655 4 0.560 5 0.502 6 0.442 7 0.402 8 0.365 9 0.335 10 0.310 Instructions: 1. Open your spreadsheet program. The first column is labelled Time/hours and second [A]/M. 2. Enter two more columns. The third labelled In[A] and the fourth 1/[A]. Use formula in your spreadsheet to fill in their values for all the times 0 to 10 hours. 3. Plot graph one: [A]/M (y axis) versus time/hours (x axis). Be sure to correctly label your axis with the appropriate unit Scale your graph appropriately so takes up the enter canvas. Decide on the type of trendline that best fits the data points. 4. Plot graph two: In[A] versus time/ hours. Label and scale your graph properly. Decide on the type of trendline that best fits the data points. 5. Plot graph three; 1/[A] versus time. Label and scale your graph properly. Again decide on the type of trendline that best fits the data points. 6. Only the graph that appears linear should have a linear trendline along with the equation for the line and the correlation coefficient. The other two graphs should be curves with no equations or coefficients. 7. From your plots determine if the reaction is first, second or third order. 8. At what time will the concentration of A be 0.380 M? Show all your work. Kinetic Data 1/[A] Time / Hours [A]/M In[A] 0 1.24 1 1 0.960 2 0.775 3 0.655 4 0.560 5 5 0.502 6 0.442 7 0.402 8 0.365 9 0.335 10 0.310 OWN
Step by Step Solution
There are 3 Steps involved in it

Get step-by-step solutions from verified subject matter experts