

Question: Instructions: Review the data source expressed in Figure 1 . Using only the information available in Figure 1 , prepare a summary report incorporating: 1
Instructions: Review the data source expressed in Figure Using only the information
available in Figure prepare a summary report incorporating:
Data Identification: Create two tables that categorize the data found in Figure as
structured and unstructured data. Include the following columns for each table:
Structured Data Table:
Data Element Name
Count
Data Type Numeric Categorical, Date, etc.
Description
Unstructured Data Table:
Data Element Name
Count if applicable
Data Format Text Image, etc.
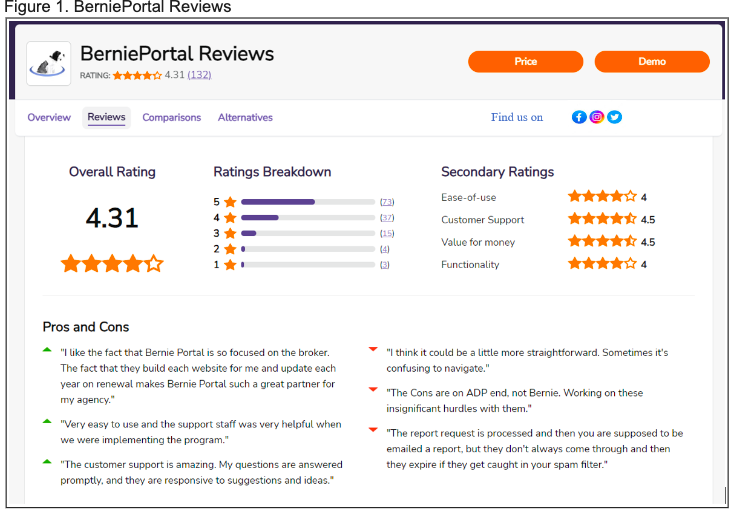
DescriptionSecondary Ratings
Ratings Breakdown
Easeofuse
Customer Support
Value for money
Functionality
Pros and Cons
"I like the fact that Bernie Portal is so focused on the broker.
The fact that they build each website for me and update each
year on renewal makes Bernie Portal such a great partner for
my agency."
"Very easy to use and the support staff was very helpful when
we were implementing the program."
"The customer support is amazing. My questions are answered
promptly, and they are responsive to suggestions and ideas."
"I think it could be a little more straightforward. Sometimes it's
confusing to navigate."
"The Cons are on ADP end, not Bernie. Working on these
insignificant hurdles with them."
"The report request is processed and then you are supposed to be
emailed a report, but they don't always come through and then
they expire if they get caught in your spam filter."
Step by Step Solution
There are 3 Steps involved in it
1 Expert Approved Answer
Step: 1 Unlock

Question Has Been Solved by an Expert!
Get step-by-step solutions from verified subject matter experts
Step: 2 Unlock
Step: 3 Unlock