

Question: Instructions: Review the data that has been collected from the Snack Survey that was run in class (data is located in Week 11 on eConestoga).
Instructions:
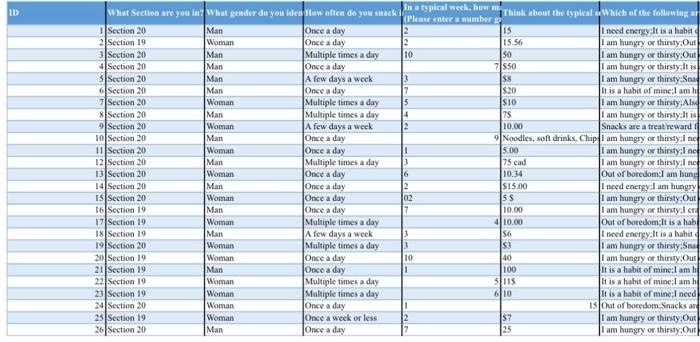
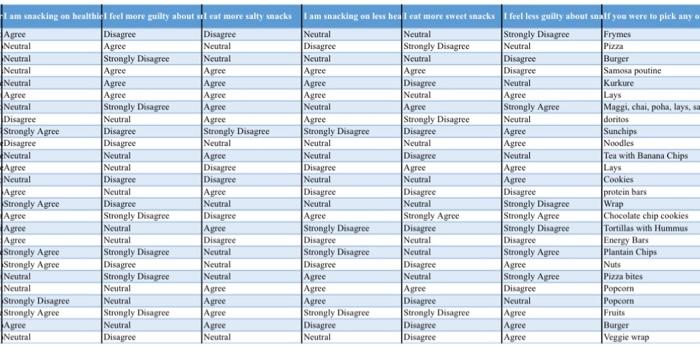
Review the data that has been collected from the Snack Survey that was run in class (data is located in Week 11 on eConestoga). Using this data, complete the following:
1) For the question "In an average week, how many snacks would vou consume in addition to vour main meals".
- Create a frequency distribution table using four (4) equal intervals (1 pts)
- Draw a histogram to present the results from your table (3 pts)
- Summarize the data in the histogram in two or less sentences (i.e. what is the histogram telling us?). (1 pts).
- Draw a pie-chart summarizing the "most common reasons you choose to snack". (3 pts) Summarize data in the pie-chart in two or less sentences (i.e. what is the chart telling us). (1 pts)
- Draw a scatterplot showing number of snacks in an average week on the X axis and maximum price per snack on the Y axis. (3 pts) Summarize the data in the scatterplot in two sentences or less (i.e. what is the graph telling us). (1 pts)
- Code the question, "I feel less guilty about snacking". Calculate the Mode, Median, and Mean for your coded response. (4 pts)
- Assume this data set you are analyzing represents a sample of the GBM/SGBM student population. For the question "What would you say, on average, is the total amount you spend on snacks for a week?"
- Manually calculate the standard deviation in excel (be sure to show your work). (5 pts).
- Assume we had a normal distribution for the data we were looking at in Question 5. Between what range (CAD $) would you expect to find 68% of the data. (1 mark)
- If the data we were looking at in Question 5 represented the population instead of a sample, would you expect the standard deviation to be higher or lower than what was calculated? Why? (2 marks)
Deliverable:
Submit an Excel document with your responses to the above. Please be sure to show detailed calculations. It is recommended to use one worksheet per question.
Step by Step Solution
There are 3 Steps involved in it
1 Expert Approved Answer
Step: 1 Unlock

Question Has Been Solved by an Expert!
Get step-by-step solutions from verified subject matter experts
Step: 2 Unlock
Step: 3 Unlock