

Question: Instructions: Select the best XLSTAT printout to answer each question. Required conditions have been met for each question. A significance level of a : 0.05
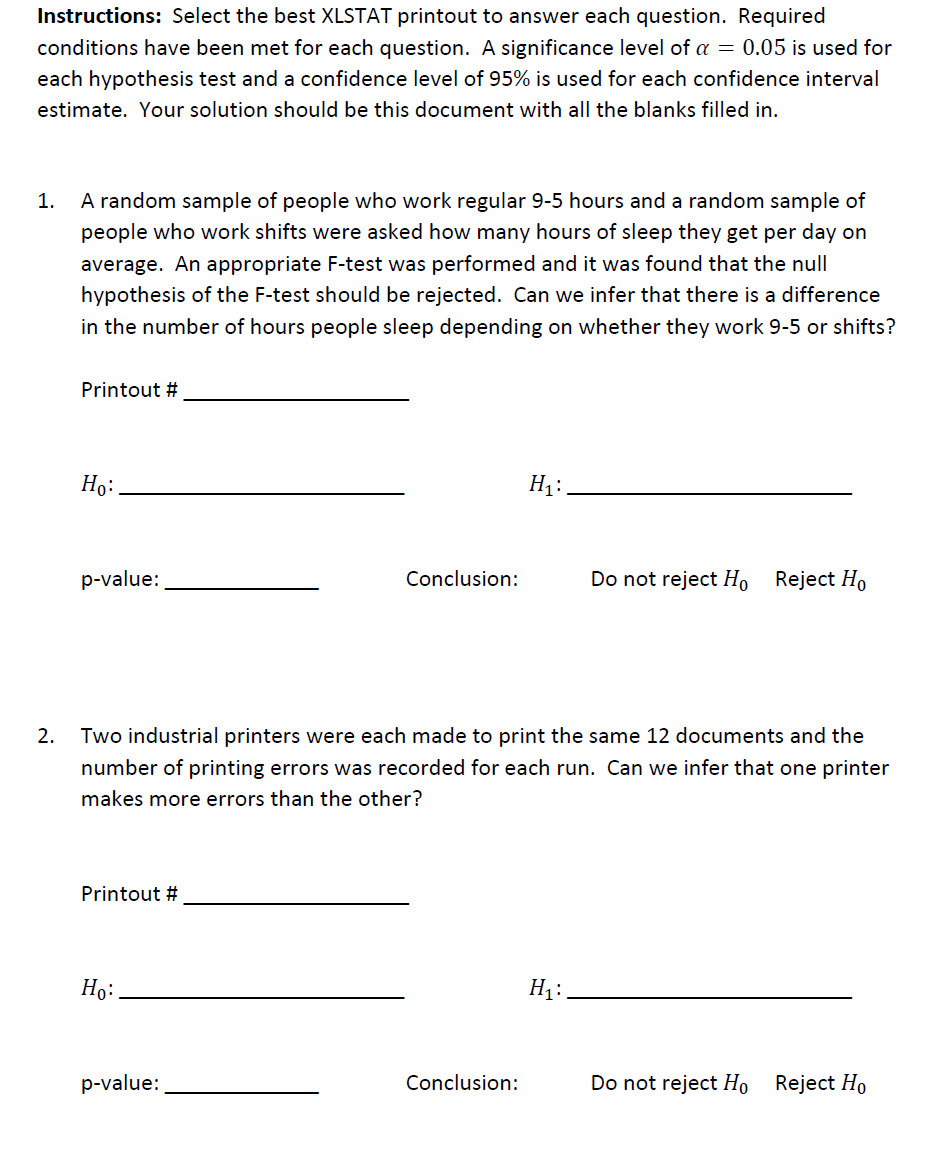
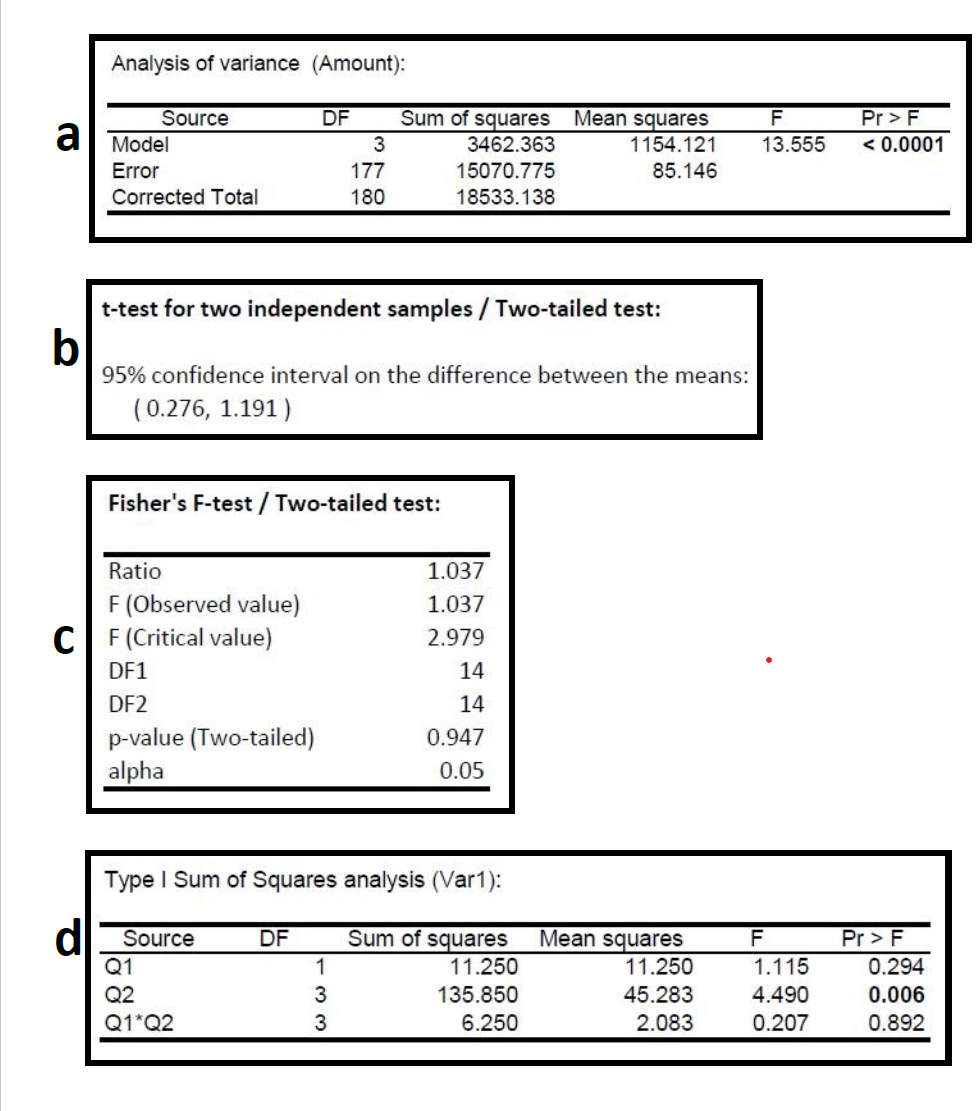
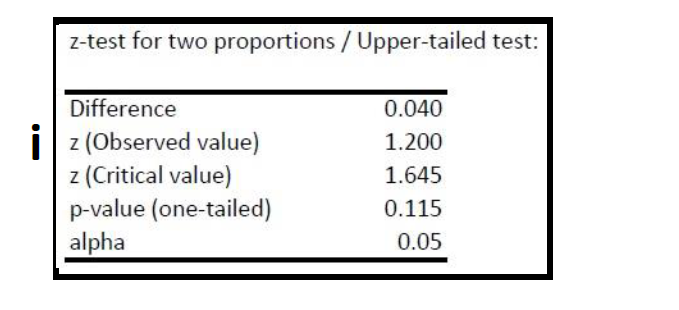
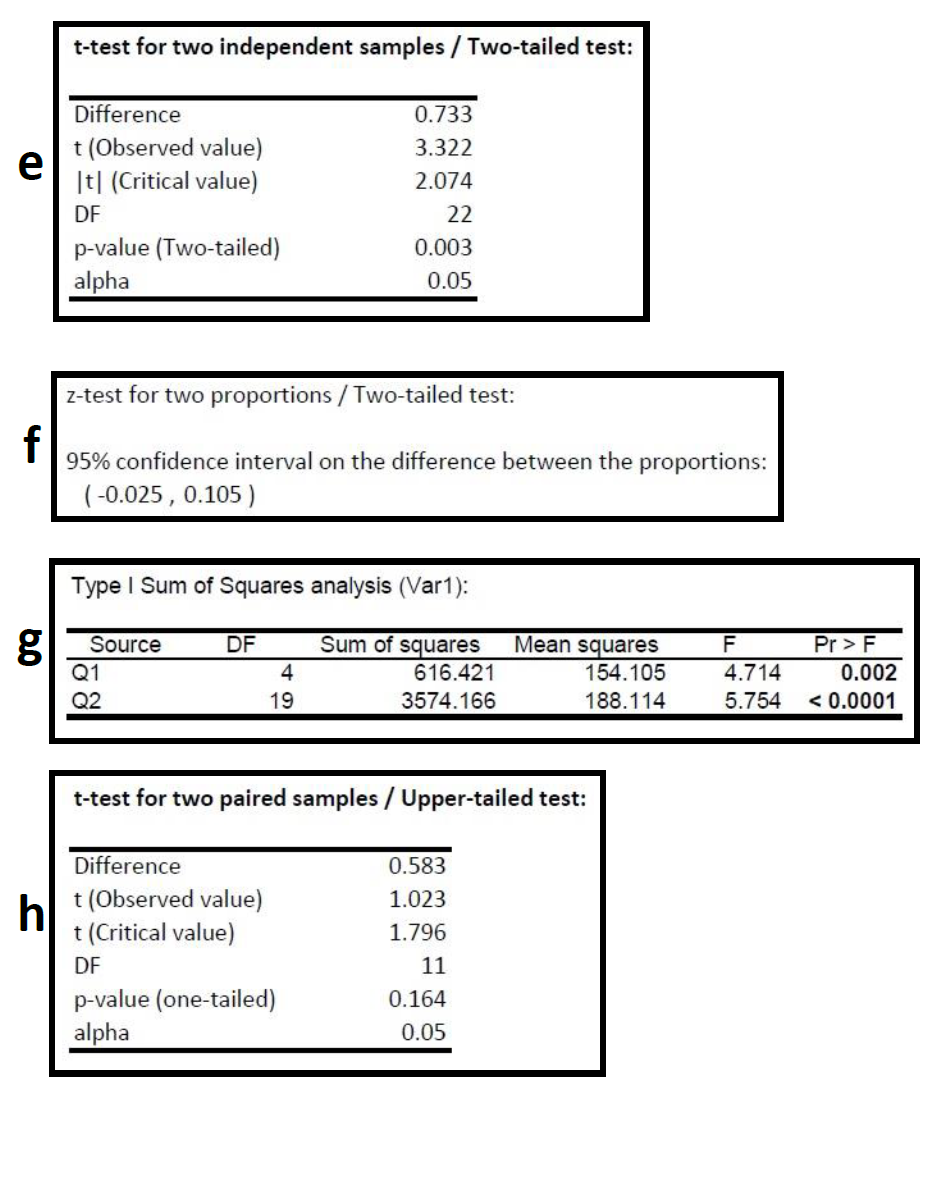
Instructions: Select the best XLSTAT printout to answer each question. Required conditions have been met for each question. A significance level of a : 0.05 is used for each hypothesis test and a confidence level of 95% is used for each confidence interval estimate. Your solution should be this document with all the blanks filled in. 1. A random sample of people who work regular 9-5 hours and a random sample of people who work shifts were asked how many hours of sleep they get per day on average. An appropriate F-test was performed and it was found that the null hypothesis of the F-test should be rejected. Can we infer that there is a difference in the number of hours people sleep depending on whether they work 9-5 or shifts? Printout # HQI H1: p-value: Conclusion: Do not reject H0 Reject H0 2. Two industrial printers were each made to print the same 12 documents and the number of printing errors was recorded for each run. Can we infer that one printer makes more errors than the other? Printout # H0: H1: p-value: Conclusion: Do not reject H0 Reject H0 Analysis of variance (Amount): Source DF Sum of squares Mean squares F Pr > F a Model 3 3462.363 1154.121 13.555 F Q1 11.250 11.250 1.115 0.294 Q2 W W - 135.850 45.283 4.490 0.006 Q1*Q2 6.250 2.083 0.207 0.892z-test for two proportions / Upper-tailed test: Difference 0.040 z (Observed value) 1.200 z (Critical value) 1.645 p-value (one-tailed) 0.115 alpha 0.05t-test for two independent samples / Two-tailed test: Difference 0.733 t (Observed value) 3.322 e It| (Critical value) 2.074 DF 22 p-value (Two-tailed) 0.003 alpha 0.05 z-test for two proportions / Two-tailed test: 95% confidence interval on the difference between the proportions: (-0.025 , 0.105 ) Type I Sum of Squares analysis (Var1): 8 Source DF Sum of squares Mean squares F Pr > F Q1 4 616.421 154. 105 4.714 0.002 Q2 19 3574.166 188.114 5.754
Step by Step Solution
There are 3 Steps involved in it

Get step-by-step solutions from verified subject matter experts