

Question: INSTRUCTIONS: Solve the following problem by providing the work anti explanation I The following table gives the frequency distribution of waiting time (in minutes} during
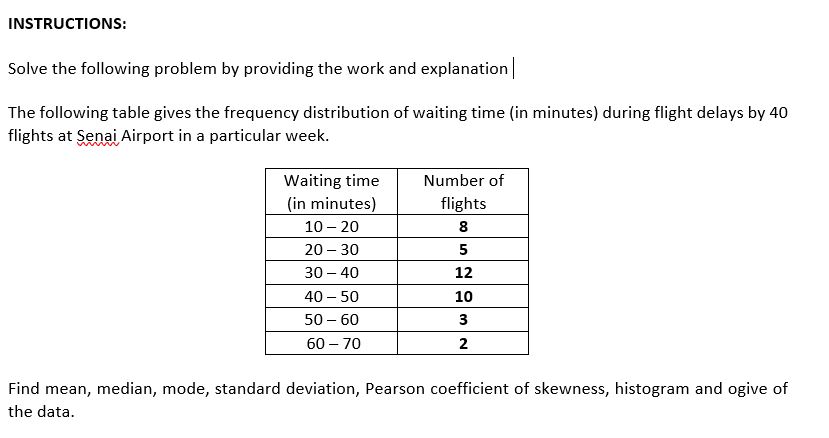
INSTRUCTIONS: Solve the following problem by providing the work anti explanation I The following table gives the frequency distribution of waiting time (in minutes} during flight delays by 40 flights at Senai Airport in a particular week. Number of [in minutes} flights 10 20 S 20 30 5 12 40 5C} 10 50 6t} 3 6030 2 Find mean, median, mode, standard deviation, Pearson coefficient of skewness, histogram and ogive of the data
Step by Step Solution
There are 3 Steps involved in it
1 Expert Approved Answer
Step: 1 Unlock

Question Has Been Solved by an Expert!
Get step-by-step solutions from verified subject matter experts
Step: 2 Unlock
Step: 3 Unlock