

Question: instructions : The hypothesis to be executed using excel is as follows. To test whether the mean age of those hospitalized for appendicitis is the
instructions : The hypothesis to be executed using excel is as follows. To test whether the mean age of those hospitalized for appendicitis is the same for non-Hispanic blacks, non-Hispanic whites, and Hispanics. A. Dataset: Appendicitis.xlsx B. Create a variable called "group" which will have the following values: i. 1 if the individual is non-Hispanic black ii. 2 if the individual is non-Hispanic white iii. 3 if the individual is Hispanic C. (Recommended) Create three columns, each containing the data for one group. D. Execute the ANOVA procedure in excel. 2. Turn in a structured abstract (no more than 300 words, not including the title and section headers, so 307 in total) with the format shown below. a. A point will be deducted if you exceed the word limit. Adhering to the word limit is essential as it forces you to get to the point; at the same time you have to be careful not to omit anything of importance. i. Do not include tables or graphs in the abstract (that would go in the main text or presentation - if you were to do one)! Determine which values from your test(s) are most important to the reader and report those in the abstract. ii. Since the word limit applies to everyone equally, no exceptions will be made!!! 3. What is important or relevant information is by definition, at least partially, subjective. However, there are certain rules that have to be followed. i. For example, in the results section you should definitely discuss the significance of your test-statistic (and report the statistic itself too). If you do not, at least one point will be deducted (yes, this is a big oversight). ii. In the methods section, provide a rationalization for using the specific test. 4. Special importance is attached to the discussion section of the abstract (see below). This is where you have to apply your creativity as a story teller. This is where you help make information out of data as it involves the reader. Try to convey why the hypothesis and the analysis are important (if you personally don't care, ask yourself why anyone would). Imagine how and what decisions could be affected by the analysis and findings and communicate this to your intended audience. Simple repetitive statements already expressed elsewhere in the abstract will result in deductions, so do not just repeat the conclusions! Abstract Objective: This contains a brief statement describing the general objective of the analysis. For example "This analysis examines ... rates for ..." Data and methods: This contains a brief description of the particular dataset used to test the hypothesis. For example, concerning the dataset briefly mention the unit of measurement, whether the data is publicly available, and what types of variables it includes. Results: This contains a brief layman's description of the ANOVA test you generated and its p-value. Conclusions: A very brief statement indicating your conclusions pertaining to the hypothesis - did your results reject the null hypothesis or not? Discussion: This is perhaps the most important section. Here you tell the story of why you believe the analysis was important - why is it "information" and not just "data"? Why would anyone within related professional or policy circles find your analysis and results interesting? How could your analysis help such individuals in terms of decision making? 5. What to turn in a. Your abstract! Complete it before accessing the assignment on blackboard, then upload your word or rtf file using question #2. b. Supporting materials! On the second page (be sure to insert a page break) right below the abstract in the same document, create a section titled "Appendix: Supporting Materials." For example, in the appendix, you should copy and paste the test results. Notice in the example below that I formatted the column widths so make everything fit without encroachment of text from one column onto another. Notice also that I formatted the numbers: for example, when values get as large as the variances reported in the table, there is typically no need for anything behind the decimal point. Remember, as was emphasized in assignment 3, presentation is important. Do not overload the reader! Anova: Single Factor SUMMARY Groups Count Sum Average Variance Q1 753 20660.7 27.43785 18.03127 Q2 753 20927.4 27.79203 11.36752 Q3 753 22183.4 29.46003 8.31578 Q4 754 23310.8 30.91618 9.174505 ANOVA Source of Variation SS df MS F P-value F crit Between Groups 5835.353 3 1945.118 165.9456 0.00000000 2.607861 Within Groups 35269.75 3009 11.72142 Total 41105.11 3012 6.
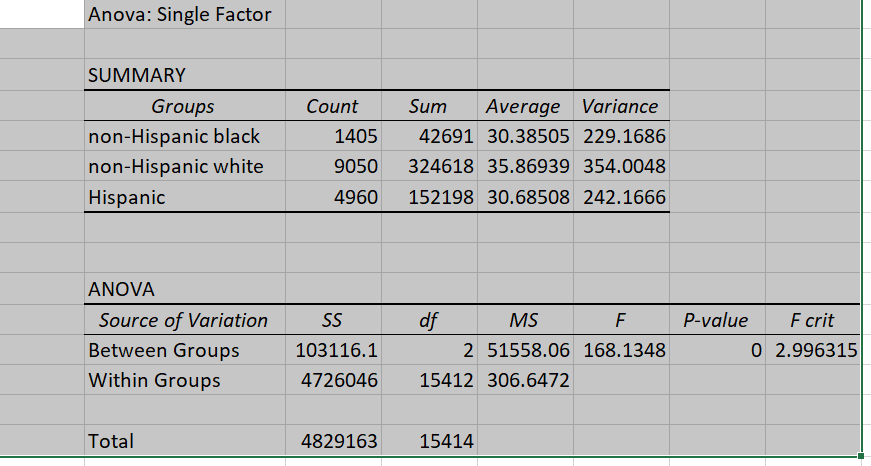
Anova: Single Factor SUMMARY Groups Count Sum Average Variance non-Hispanic black 1405 42691 30.38505 229.1686 non-Hispanic white 9050 324618 35.86939 354.0048 Hispanic 4960 152198 30.68508 242.1666 ANOVA Source of Variation SS df MS F P-value F crit Between Groups 103116.1 2 51558.06 168.1348 0 2.996315 Within Groups 4726046 15412 306.6472 Total 4829163 15414
Step by Step Solution
There are 3 Steps involved in it

Get step-by-step solutions from verified subject matter experts