

Question: Instructions: The table below reports various financial ratios for two Australian Airlines; Qantas Airways, and Alliance Aviation Services for three years (2019, 2020, 2021).
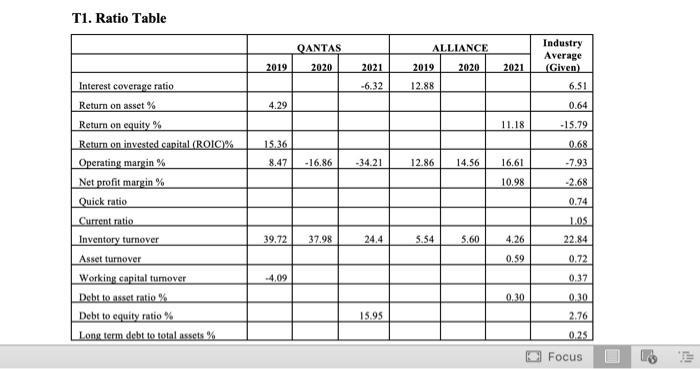
Instructions: The table below reports various financial ratios for two Australian Airlines; Qantas Airways, and Alliance Aviation Services for three years (2019, 2020, 2021). 1. From the given Annual Reports of the companies, and using the formulas provided, calculate and complete the ratio table below for the companies for the three years (2019, 2020, 2021). 2. From the ratios calculated in Q1, analyze the 'profitability' and 'efficiency of the two companies for the relevant years (use three ratios each for profitability and efficiency). Consider industry averages when formulating your analysis. 3. If you were contemplating an investment in any of these two airline companies, identify | what other information (non-financial) would assist your investment decision and why this information (two) are important to you. Requirements: You will present in a clear and concise six to eight minute (6-8) video recording that includes an introduction, a completed ratio table, key analysis ('profitability' and 'efficiency ratios), non- financial factors and a conclusion. T1. Ratio Table Interest coverage ratio. Return on asset % Return on equity % Return on invested capital (ROIC)% Operating margin % Net profit margin % Quick ratio Current ratio Inventory turnover Asset turnover Working capital turnover Debt to asset ratio % Debt to equity ratio % Long term debt to total assets % 2019 4.29 15.36 8.47 39.72 -4.09 QANTAS 2020 2021 -6.32 -16.86 -34.21 37.98 24.4 15.95 ALLIANCE 2019 12.88 12.86 5.54 2020 14.56 5.60 2021 11.18 16.61 10.98 4.26 0.59 0.30 Industry Average (Given) 6.51 0.64 -15.79 0.68 -7.93 -2.68 0.74 1.05 22.84 0.72 0.37 0.30 2.76 0.25 Focus
Step by Step Solution
3.45 Rating (148 Votes )
There are 3 Steps involved in it

Get step-by-step solutions from verified subject matter experts