

Question: Instructions There are four parts to this problem. Use Excel or the visualization software of your or your instructor's choice to perform the following: a.
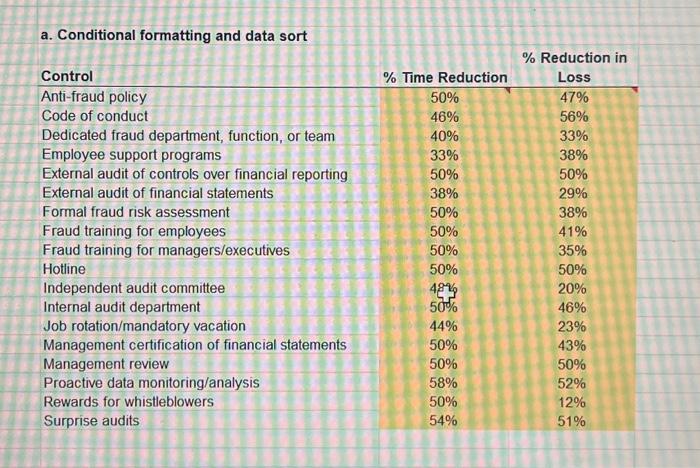
Instructions There are four parts to this problem. Use Excel or the visualization software of your or your instructor's choice to perform the following: a. The data have been duplicated in the Student Work Area. Use conditional formatting data bars for the data in both columns. Sort this data by largest percentage reduction of time, and then as a secondary sort, by the largest percentage of loss reduction. b. Create a column chart comparing the two data items in part a, with each percentage reduction in a separate column for each control. Change the maximum bound of the percentages on the vertical axis to 60%. Include a descriptive chart title, axes labels legend, and properly formatted axes. a. Conditional formatting and data sort
Step by Step Solution
There are 3 Steps involved in it

Get step-by-step solutions from verified subject matter experts