

Question: Instructions: This is an individual effort, open note/book exercise. You may consult your notes, but you cannot discuss the problem or exchange information with any
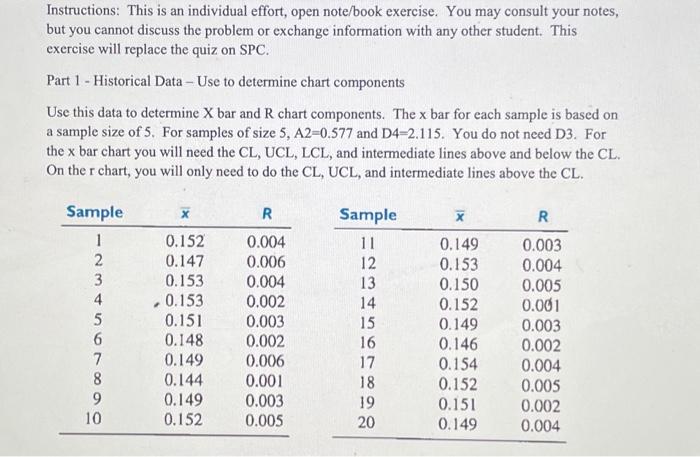
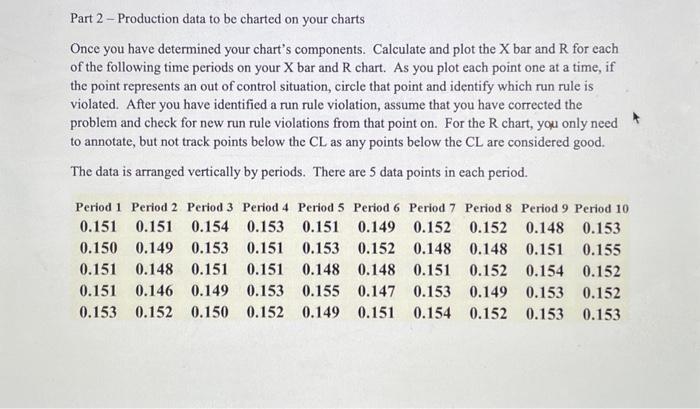
Instructions: This is an individual effort, open note/book exercise. You may consult your notes, but you cannot discuss the problem or exchange information with any other student. This exercise will replace the quiz on SPC. Part 1 - Historical Data - Use to determine chart components Use this data to determine X bar and R chart components. The x bar for each sample is based on a sample size of 5. For samples of size 5,A2=0.577 and D4=2.115. You do not need D3. For the x bar chart you will need the CL, UCL, LCL, and intermediate lines above and below the CL. On the r chart, you will only need to do the CL, UCL, and intermediate lines above the CL. Part 2 - Production data to be charted on your charts Once you have determined your chart's components. Calculate and plot the X bar and R for each of the following time periods on your X bar and R chart. As you plot each point one at a time, if the point represents an out of control situation, circle that point and identify which run rule is violated. After you have identified a run rule violation, assume that you have corrected the problem and check for new run rule violations from that point on. For the R chart, you only need to annotate, but not track points below the CL as any points below the CL are considered good. The data is arranged vertically by periods. There are 5 data points in each period
Step by Step Solution
There are 3 Steps involved in it

Get step-by-step solutions from verified subject matter experts