

Question: Instructions: Use Excel formulas and links to cells in order to answer the following questions. Using the data in the table above, create a flexible
Instructions:
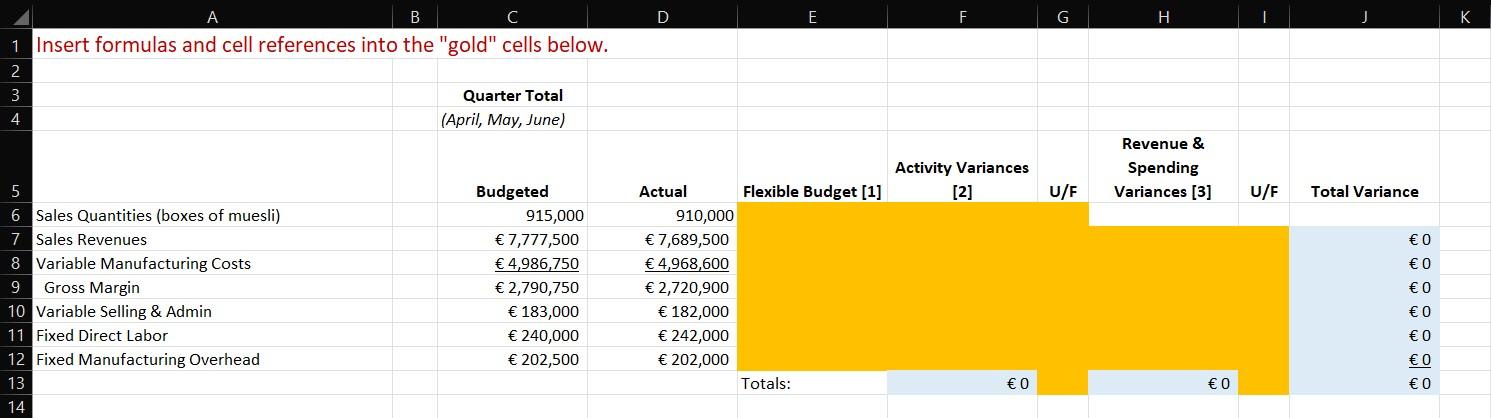
Use Excel formulas and links to cells in order to answer the following questions.
Using the data in the table above, create a flexible budget for the quarter.
Calculate the activity variances and indicate whether they are unfavorable or favorable.
Calculate the revenue and spending variances and indicate whether they are unfavorable or
favorable.
Is the Sales manager justified in stating that they did ?just fine? last quarter? Why or why not?
Is the Purchasing manager justified in bragging about the cost of materials for the quarter? Why or why not?
Hypothesize as to the possible cause(s) of each of the variances.
What should be the management team?s response to the variance analysis of the flexible budget? Which variances should be investigated further and why?
A B C D E F G H K 1 Insert formulas and cell references into the "gold" cells below. 3 Quarter Total 4 (April, May, June) Revenue & Activity Variances Spending 5 Budgeted Actual Flexible Budget [1] [2] U/F Variances [3] U/F Total Variance 6 Sales Quantities (boxes of muesli) 7 Sales Revenues 8 Variable Manufacturing Costs 9 Gross Margin 10 Variable Selling & Admin 11 Fixed Direct Labor 12 Fixed Manufacturing Overhead 915,000 910,000 7,777,500 4,986,750 2,790,750 183,000 240,000 202,500 7,689,500 4,968,600 2,720,900 182,000 242,000 202,000 0 0 0 0 0 0 0 13 Totals: 0 0 14
Step by Step Solution
3.50 Rating (157 Votes )
There are 3 Steps involved in it
Budget Variance Activity Variance is measured as difference between Planning S... View full answer

Get step-by-step solutions from verified subject matter experts