

Question: Instructions: Use the data tool to answer the questions below. Choose one or two series as directed and press Plot Data Understanding Macroeconomic Data .
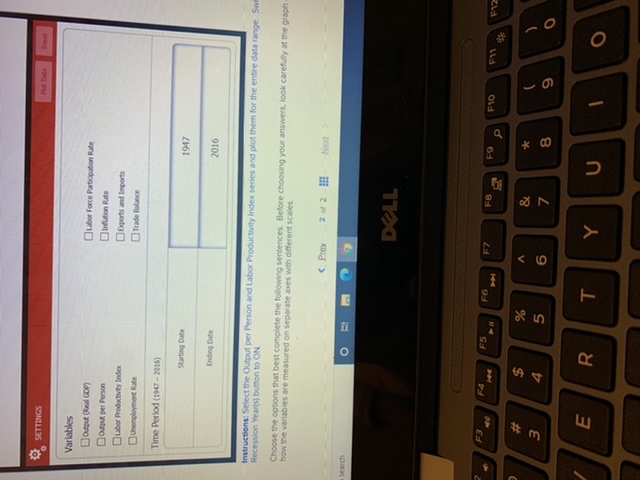

Instructions: Use the data tool to answer the questions below. Choose one or two series as directed and press Plot Data" Understanding Macroeconomic Data . MACROECONOMIC DATA 2092 Year earch O DELL F7 F10 m O F > C O LL ISETTINGS Plot Data Reurt Variables Labor Force Participation Rate Output per Person Inflation Rate Labor Productivity Index Exports and Imports Unemployment Rate Trade Balance Time Period (1947 - 2018) Starting Dute 1947 Ending Date 2016 Instructions: Select the Output per Person and Labor Productivity Index series and plot them for the entire data range. Sw Recession Yearjil button to ON. Choose the options that best complete the following sentences. Before choosing your answers, look carefully at the graph how the variables are measured on separate axes with different scales. C OLiber Productivity Index DOparts and Imports Time Plod (160 - N10) 1947 Ending Date 2016 Instructions: Select the Output per Person and Labor Productivity Index series and plot them for the entire dats range. Switch the Recession Yearly button to ON Choose the options that beil complete the following sentences. Before choosing your answers, look carefully at the graph and note how the variables are measured on separate ares with different scales. al Labor productivity, a measure of output per worker Is [Cica is salad Tv]higher than output per person because the population is Kokomo winch)] the workforce bj Output per Person and Labor Productivity have generally (cack is selects ] over time c) During recessions, Output per Person tends to [Click to selegy w O # m O C O LL I y
Step by Step Solution
There are 3 Steps involved in it

Get step-by-step solutions from verified subject matter experts