

Question: Instructions Using the Excel Financial Forecast worksheet from Assignment #1, determine the sensitivity of the model by adjusting the values of growth rate in sales
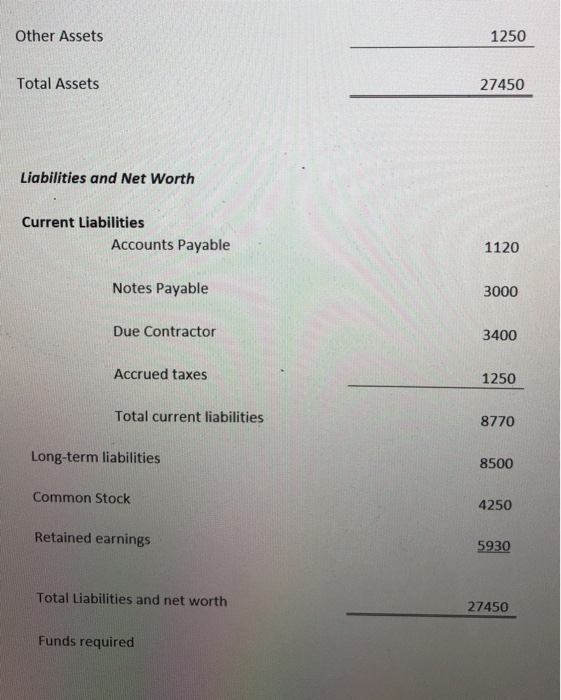
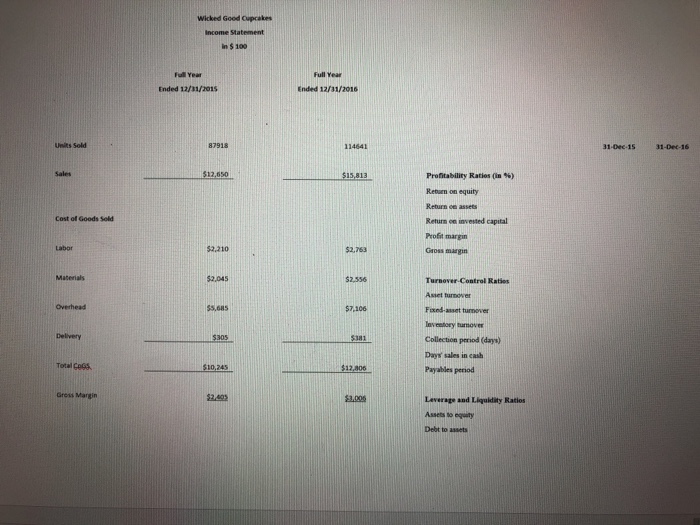
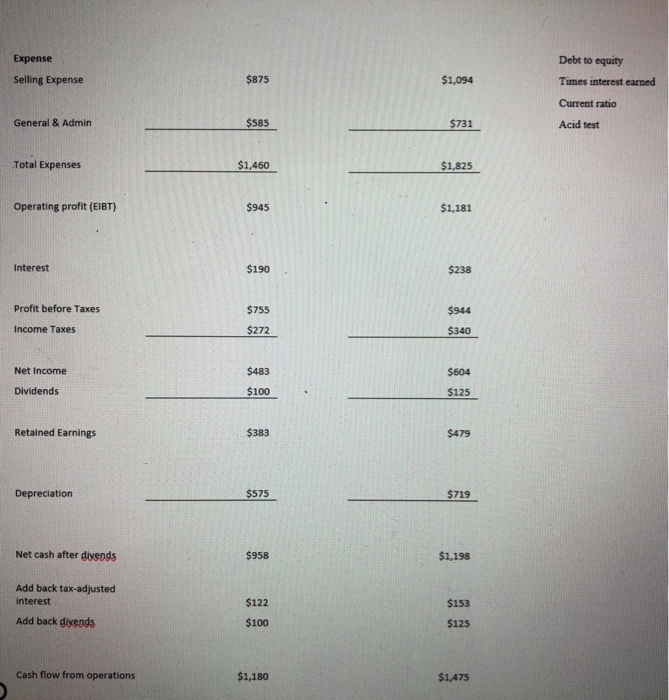
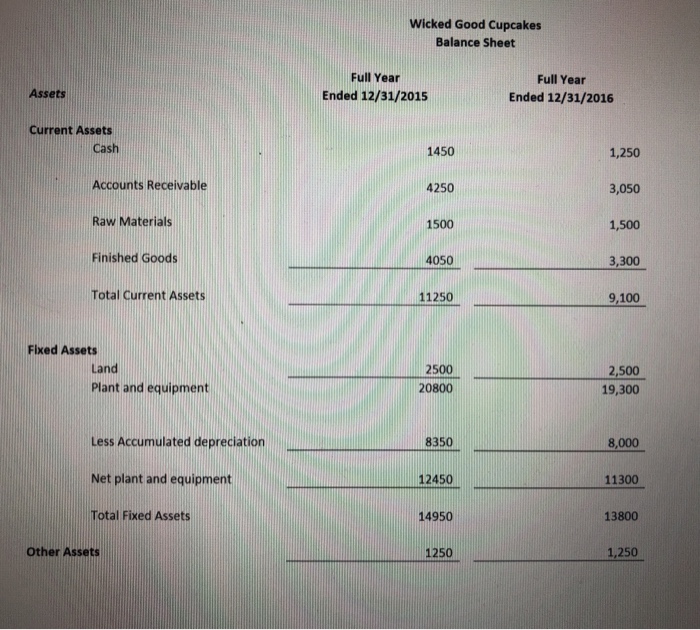
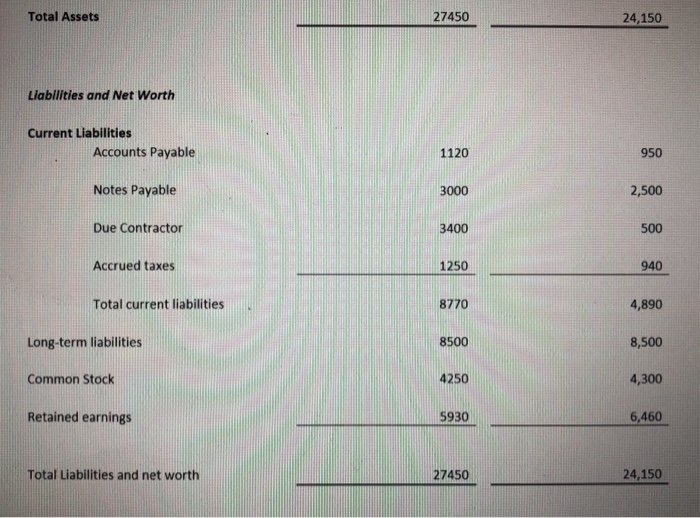
Instructions Using the Excel Financial Forecast worksheet from Assignment #1, determine the sensitivity of the model by adjusting the values of growth rate in sales and cost of goods soldet sales. Increase and decreases the % values for 2016 and observe and record the results. Create an Excel chart for each (growth rate in sales and cost of goods soldet sales) and the resulting impact on external funding required. For example: Change growth in sales from 70% to 95% by 5% increments, recording and charting the resulting change in external funding required. Chart this data. In a two page executive summary explain your finding. Include the two charts (properly labeled) in your summary. Requirements:. . All questions posed must be addressed completely. Length: two-page executive summary . Include the two charts. All sources used must be properly cited in APA format Instructions Using the Excel Financial Forecast worksheet from Assignment #1, determine the sensitivity of the model by adjusting the values of growth rate in sales and cost of goods soldet sales. Increase and decreases the % values for 2016 and observe and record the results. Create an Excel chart for each (growth rate in sales and cost of goods soldet sales) and the resulting impact on external funding required. For example: Change growth in sales from 70% to 95% by 5% increments, recording and charting the resulting change in external funding required. Chart this data. In a two page executive summary explain your finding. Include the two charts (properly labeled) in your summary. Requirements:. . All questions posed must be addressed completely. Length: two-page executive summary . Include the two charts. All sources used must be properly cited in APA format
Step by Step Solution
There are 3 Steps involved in it

Get step-by-step solutions from verified subject matter experts