

Question: Instructions: Using the Income Statement and Balance Sheet below, calculate each of the ratios below in the yellow cell. Use formulas to show your work.
Instructions: Using the Income Statement and Balance Sheet below, calculate each of the ratios below in the yellow cell. Use formulas to show your work.
For each ratio, provide a brief indicator analysis and comparative analysis as shown below.
| Indicator Analysis: | Briefly explain what the indicator means |
| Comparative Analysis | Compare WTRH 2017 with industry averages and explain how WTRH did compared to other comparable hospitals. |
DATA to calculate ratios
| WEST TEXAS REGIONAL HOSPITAL | |
| OPERATING DATA | 2017 |
| Net inpatient revenue | $36,200,000 |
| Net outpatient revenue | $67,850,000 |
| Net patient service revenue | $104,050,000 |
| Inpatient operating expenses | $30,825,000 |
| Total salaries | $31,050,000 |
| Total discharges | 5,925 |
| Inpatient days | 34,575 |
| # licensed and staffed beds | 200 |
| Average daily census | 95 |
| Total FTEs | 1,025 |
| Inpatient FTEs | 575 |
Format of assignment is below in images:
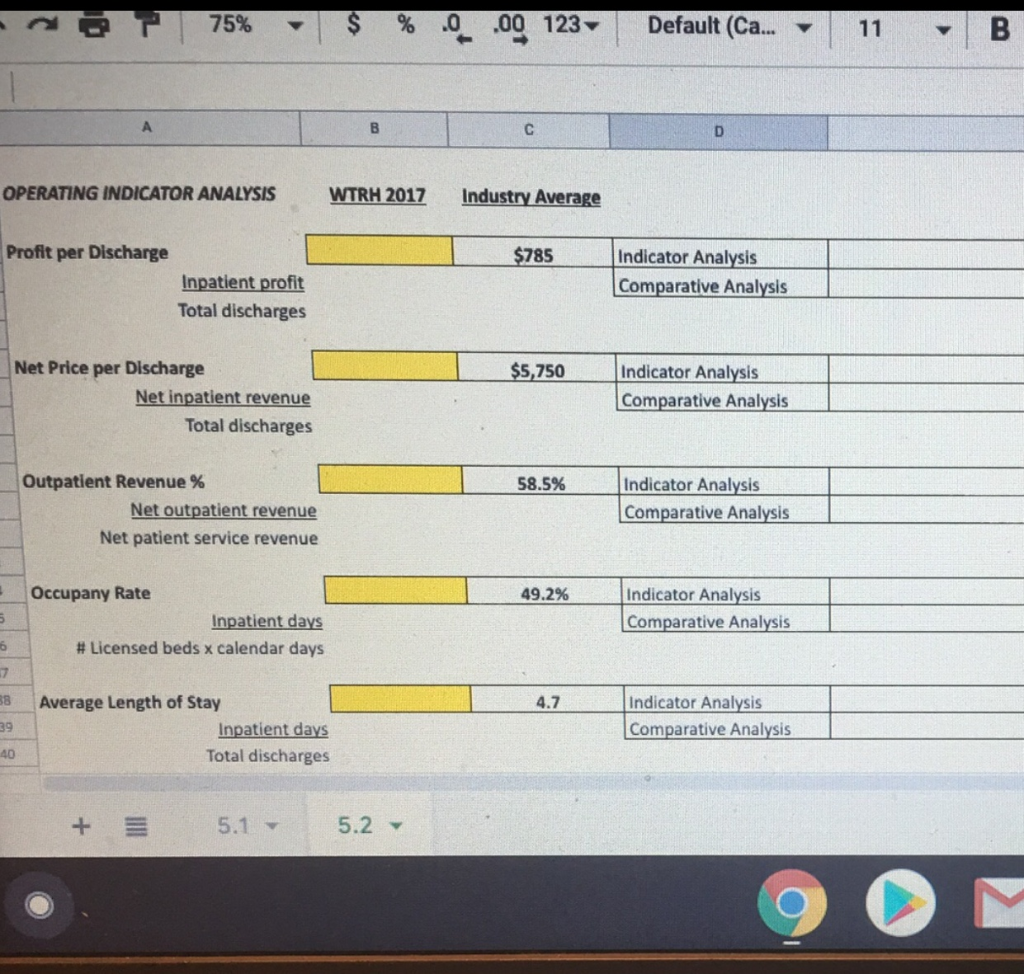
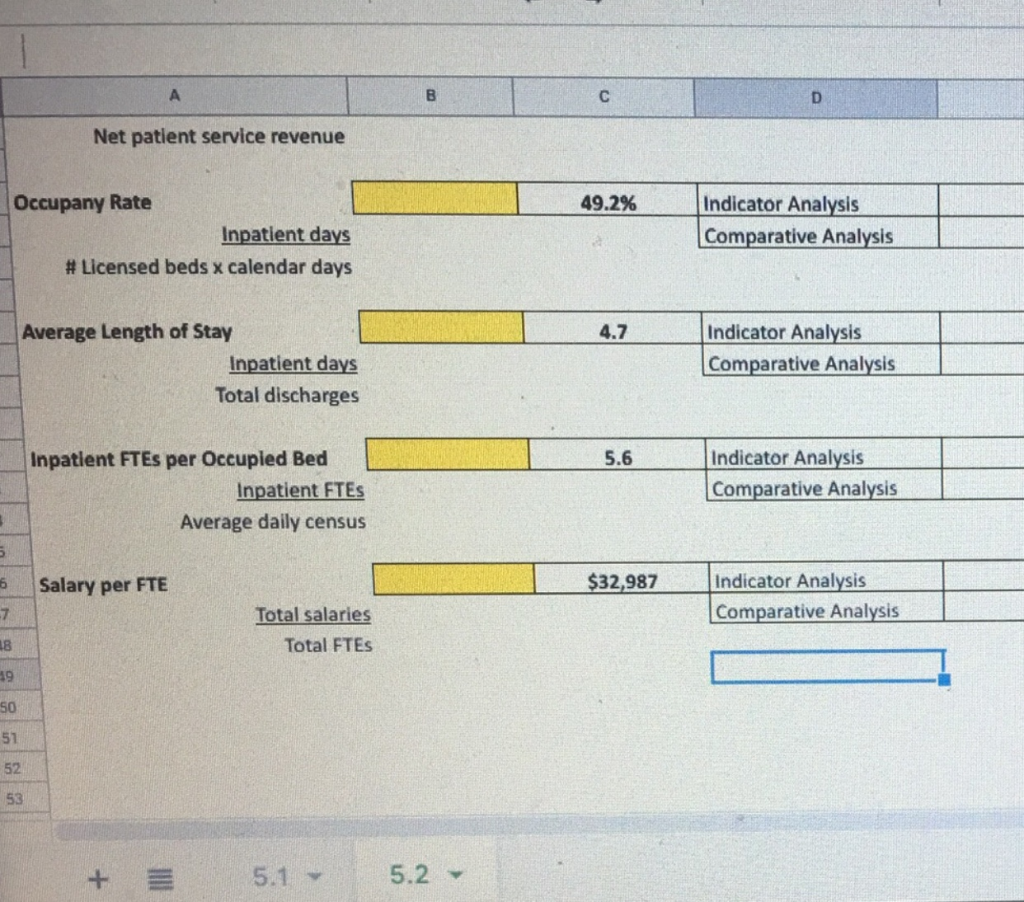
75% - $ % 0.00 123- Default (Ca... - 11 - B OPERATING INDICATOR ANALYSIS WTRH 2017 Industry Average Profit per Discharge $785 Indicator Analysis Comparative Analysis Inpatient profit Total discharges $5,750 Net Price per Discharge Net inpatient revenue Total discharges Indicator Analysis Comparative Analysis 58.5% Outpatient Revenue % Net outpatient revenue Net patient service revenue Indicator Analysis Comparative Analysis 49.2% Occupany Rate Inpatient days # Licensed beds x calendar days Indicator Analysis Comparative Analysis Average Length of Stay Inpatient days Total discharges Indicator Analysis Comparative Analysis 5.1 - 5.2 9 O B C D Net patient service revenue 49.2% Occupany Rate Inpatient days # Licensed beds x calendar days Indicator Analysis Comparative Analysis Average Length of Stay Inpatient days Total discharges Indicator Analysis Comparative Analysis 5.6 Inpatient FTEs per Occupied Bed Inpatient FTES Average daily census Indicator Analysis Comparative Analysis Salary per FTE $32,987 Indicator Analysis Comparative Analysis Total salaries Total FTES 51 + = 5.1 5.2
Step by Step Solution
There are 3 Steps involved in it

Get step-by-step solutions from verified subject matter experts