

Question: 2. Using the data from the Income Statement and Balance Sheet, provide the correct calculation of the activity ratios and an assessment of the
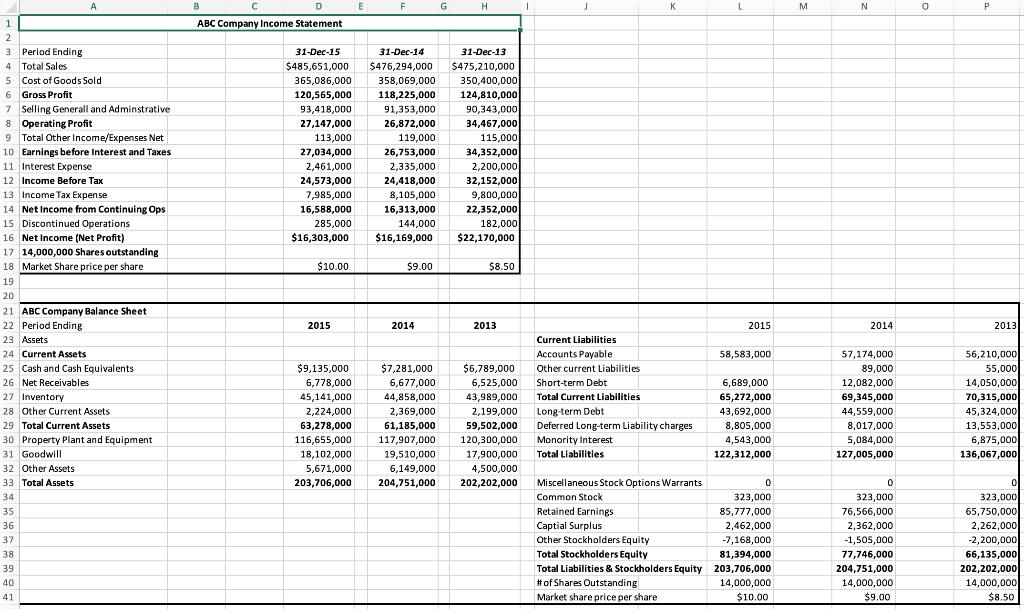
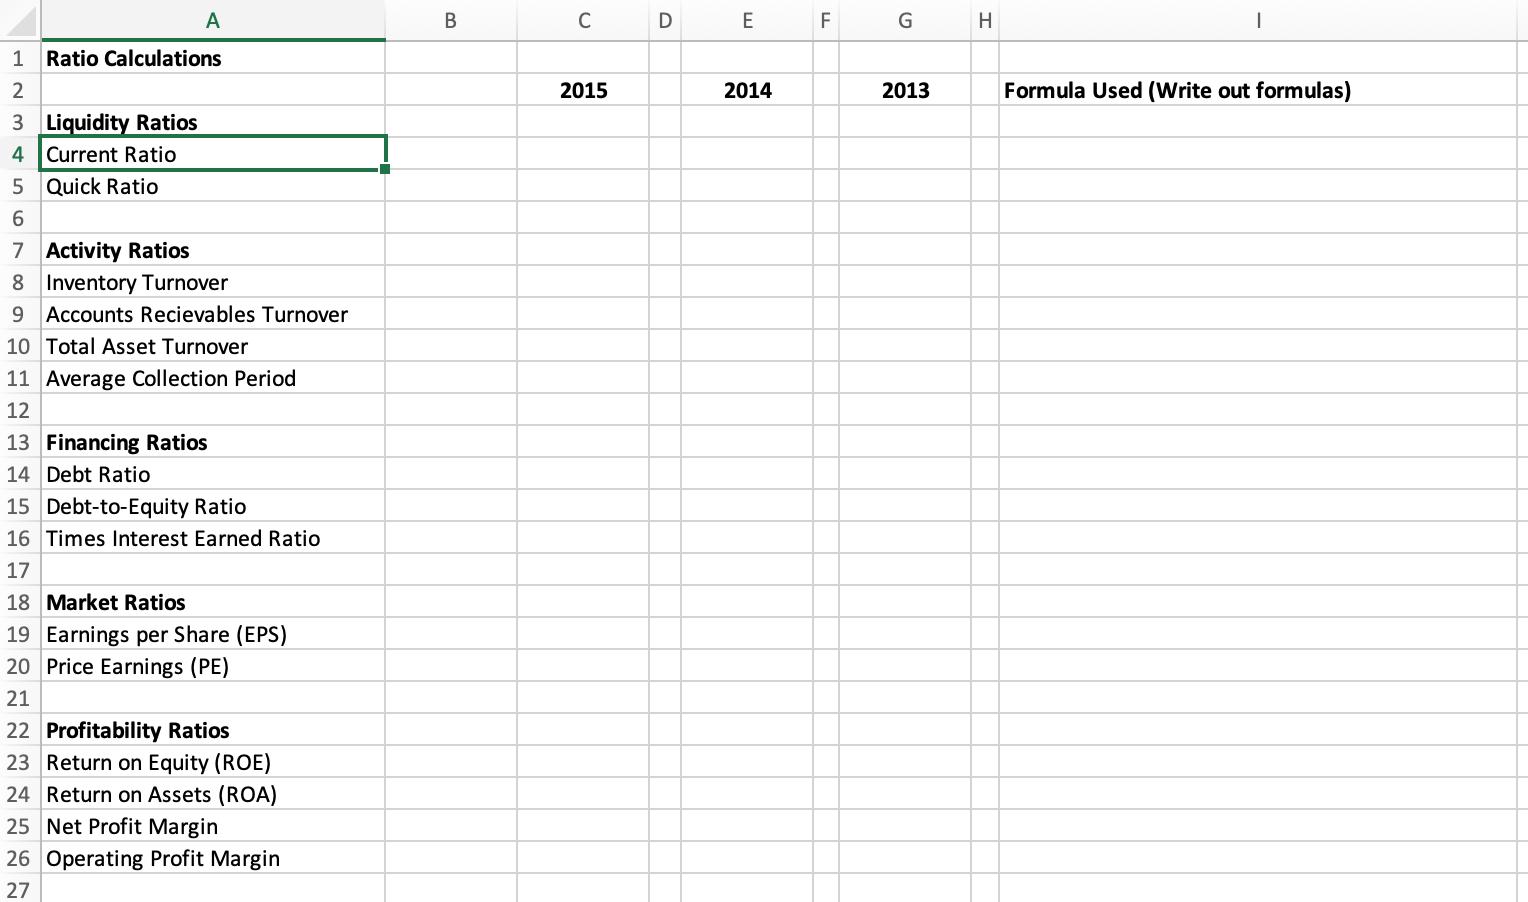
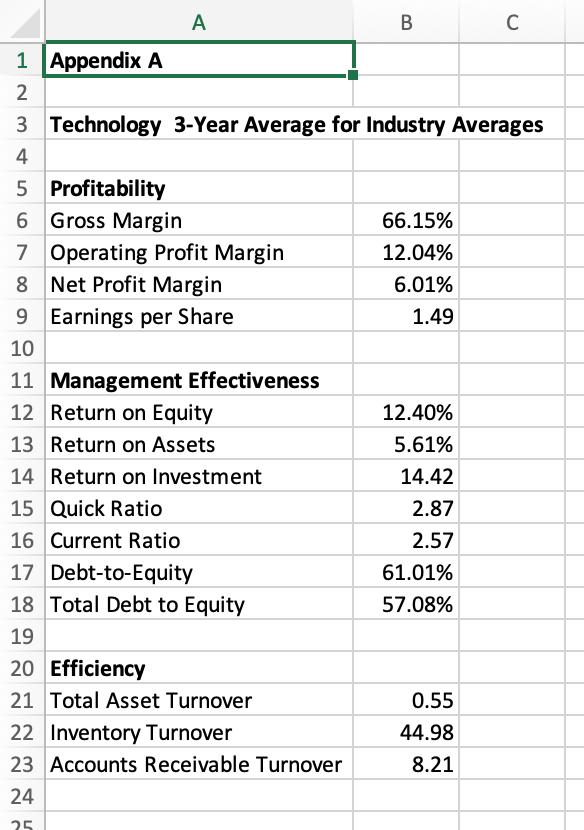
2. Using the data from the Income Statement and Balance Sheet, provide the correct calculation of the activity ratios and an assessment of the company's ability to maintain liquidity. Include the proper assessment of outcomes as positive or negative trends when all four ratio outcomes are factored as a group. Activity Ratios Inventory Turnover Accounts Receivables Turnover Total Asset Turnover Average Collection Period Instructions You will present a definition of the classification by citing the course text and other scholarly sources. Your paper should include a measure of, and analysis of, financial outcomes based on the ratios for each financial ratio classification (i.e., the liquidity classifications of ratios are based upon the quick and current ratio outcomes). You will calculate ratios for each classification for the 3 years of data (i.e., the current ratio may have been 1.5 the first year, 1.35 the second year, and .75 in the most recent year). It is based on these results that you will measure financial performance, or trends, from one year to the next. It is imperative that the ratios numbers, and quantitative outcomes, support your analysis. B C E F G K N 1 ABC Company Income Statement 2 3 Period Ending 4 Total Sales 5 Cost of Goods Sold 6 Gross Profit 7 Selling Generall and Adminstrative 8 Operating Profit 9 Total Other Income/Expenses Net 31-Dec-15 31-Dec-14 31-Dec-13 $485,651,000 365,086,000 $476,294,000 358,069,000 %$475,210,000 350,400,000 120,565,000 118,225,000 124,810,000 93,418,000 91,353,000 90,343,000 34,467,000 115,000 34,352,000 27,147,000 26,872,000 113,000 119,000 10 Earnings before Interest and Taxes 27,034,000 26,753,000 11 Interest Expense 2,461,000 2,335,000 2,200,000 32,152,000 9,800,000 22,352,000 12 Income Before Tax 24,573,000 7,985,000 16,588,000 285,000 $16,303,000 24,418,000 8,105,000 13 Income Tax Expense 14 Net Income from Continuing Ops 16,313,000 144,000 $16,169,000 15 Discontinued Operations 182,000 16 Net Income (Net Profit) $22,170,000 17 14,000,000 Shares outstanding 18 Market Share price per share $10.00 $9.00 $8.50 19 20 21 ABC Company Balance Sheet 22 Period Ending 2015 2014 2013 2015 2014 2013 23 Assets Current Liabilities 58,583,000 56,210,000 55,000 14,050,000 70,315,000 45,324,000 13,553,000 6,875,000 136,067,000 24 Current Assets Accounts Payable 57,174,000 25 Cash and Cash Equivalents $9,135,000 $7,281,000 $6,789,000 Other current Liabilities 89,000 26 Net Receivables 6,778,000 6,677,000 6,525,000 Short-term Debt 6,689,000 12,082,000 27 Inventory 45,141,000 44,858,000 43,989,000 Total Current Liabilities 65,272,000 69,345,000 2,369,000 61,185,000 Long-term Debt Deferred Long-term Liability charges 28 Other Current Assets 2,224,000 2,199,000 43,692,000 44,559,000 29 Total Current Assets 63,278,000 59,502,000 8,805,000 8,017,000 30 Property Plant and Equipment 31 Goodwill 116,655,000 117,907,000 120,300,000 4,543,000 Monority Interest Total Liabilities 5,084,000 18,102,000 19,510,000 17,900,000 122,312,000 127,005,000 6,149,000 204,751,000 32 Other Assets 5,671,000 203,706,000 4,500,000 33 Total Assets 202,202,000 Miscellaneous Stock Options Warrants 323,000 65,750,000 2,262,000 -2,200,000 66,135,000 202,202,000 14,000,000 $8.50 34 Common Stock 323,000 323,000 Retained Earnings Captial Surplus 35 85,777,000 76,566,000 2,462,000 -7,168,000 36 2,362,000 37 Other Stockholders Equity -1,505,000 38 Total Stockholders Equity 81,394,000 77,746,000 39 Total Liabilities & Stockholders Equity 203,706,000 204,751,000 40 # of Shares Outstanding 14,000,000 14,000,000 $9.00 41 Market share price per share $10.00 A C D E F 1 Ratio Calculations 2015 2014 2013 Formula Used (Write out formulas) 3 Liquidity Ratios 4 Current Ratio 5 Quick Ratio 7 Activity Ratios 8 Inventory Turnover 9 Accounts Recievables Turnover 10 Total Asset Turnover 11 Average Collection Period 12 13 Financing Ratios 14 Debt Ratio 15 Debt-to-Equity Ratio 16 Times Interest Earned Ratio 17 18 Market Ratios 19 Earnings per Share (EPS) 20 Price Earnings (PE) 21 22 Profitability Ratios 23 Return on Equity (ROE) 24 Return on Assets (ROA) 25 Net Profit Margin 26 Operating Profit Margin 27 A C 1 Appendix A 2 3 Technology 3-Year Average for Industry Averages 4 5 Profitability 6 Gross Margin 7 Operating Profit Margin 8 Net Profit Margin 66.15% 12.04% 6.01% 9 Earnings per Share 1.49 10 11 Management Effectiveness 12 Return on Equity 12.40% 13 Return on Assets 5.61% 14 Return on Investment 14.42 15 Quick Ratio 2.87 16 Current Ratio 2.57 17 Debt-to-Equity 61.01% 18 Total Debt to Equity 57.08% 19 20 Efficiency 21 Total Asset Turnover 0.55 22 Inventory Turnover 44.98 23 Accounts Receivable Turnover 8.21 24 25
Step by Step Solution
3.41 Rating (148 Votes )
There are 3 Steps involved in it
Market value ratio a EPS Earning per share Earning per share ... View full answer

Get step-by-step solutions from verified subject matter experts
Document Format (2 attachments)
636214674df76_236022.pdf
180 KBs PDF File
636214674df76_236022.docx
120 KBs Word File