

Question: INTEGRATED CASE PART II D'LEON (Financial Management) Chapter 4 Use the DuPont equation to provide a summary and overview of DLeons financial condition as projected
INTEGRATED CASE PART II D'LEON (Financial Management) Chapter 4
-
Use the DuPont equation to provide a summary and overview of DLeons financial condition as projected for 2017. What are the firms major strengths and weaknesses?
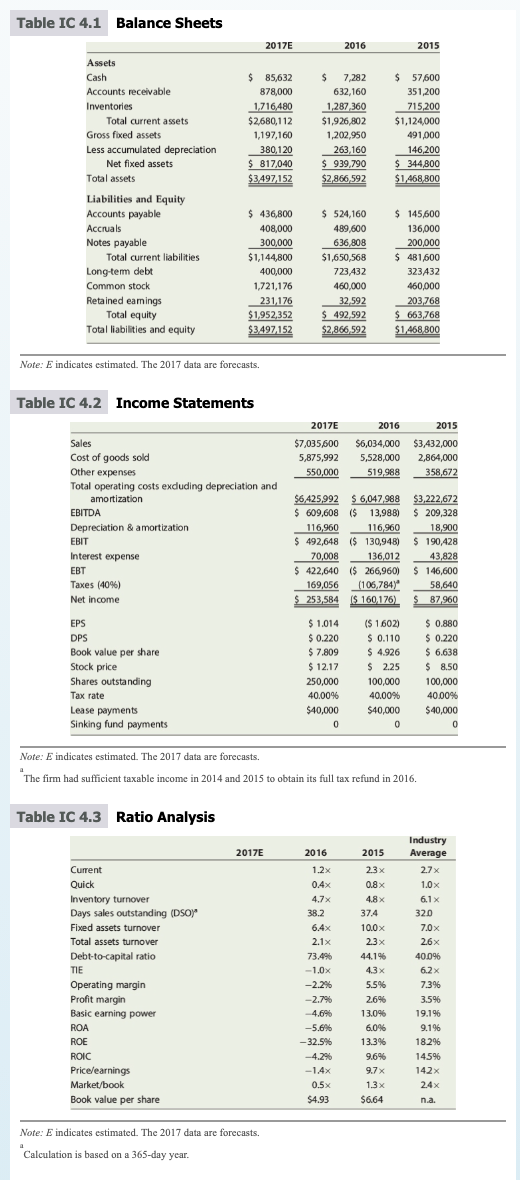
Table IC 4.1 Balance Sheets 2017E 2016 2015 $ 85,632 878,000 1.716,480 $2,680,112 1,197,160 380,120 $ 817,040 $3.497,152 $ 7,282 632,160 1,287 360 $1,926,802 1,202,950 263,160 $ 939.790 $2,866,592 $ 57,600 351,200 715,200 $1,124,000 491,000 146,200 $ 344,800 $1,468 800 Assets Cash Accounts receivable Inventories Total current assets Gross fixed assets Less accumulated depreciation Net fixed assets Total assets Liabilities and Equity Accounts payable Accruals Notes payable Total current liabilities Long-tem debt Common stock Retained eamings Total equity Total liabilities and equity $ 436,800 408,000 300,000 $1,144,800 400,000 1,721,176 231,176 $1,952,352 $3,497,152 $ 524,160 489,600 636 808 $1,650,568 723432 460,000 32,592 $ 492,592 $2.866592 $ 145,600 136,000 200,000 $ 481,500 323432 460,000 203,768 $ 663,768 $1,468,800 Note: E indicates estimated. The 2017 data are forecasts. Table IC 4.2 Income Statements 2017E $7,035,600 5,875,992 550,000 2016 2015 $6,034,000 $3,432,000 5,528,000 2,864,000 519,988 358,672 Sales Cost of goods sold Other expenses Total operating costs excluding depreciation and amortization EBITDA Depreciation & amortization EBIT Interest expense EBT Taxes (40%) Net income $6,425,992 $6,047,988 $3,222,672 $ 609,608 ($ 13,988) $ 209,328 116,960 116,960 18,900 $ 492,648 ($ 130,948) $ 190,428 70,008 136,012 43,828 $ 422,640 ($ 266,960) $ 146,600 169,056 (106,784) 58,640 $ 253,584 ($ 160,176) $ 87,960 EPS DPS Book value per share Stock price Shares outstanding Tax rate Lease payments Sinking fund payments $ 1.014 $ 0.220 $ 7.809 $ 12.17 250,000 40.00% % $40,000 0 ($ 1602) $ 0.110 $ 4.926 $ 2.25 100,000 40.00% $40,000 0 $ 0.880 $ 0.220 $ 6.638 $ 8.50 100,000 40.00% $40,000 0 Note: E indicates estimated. The 2017 data are forecasts. The firm had sufficient taxable income in 2014 and 2015 to obtain its full tax refund in 2016. Table IC 4.3 Ratio Analysis 2017E 2016 2015 Current Quick Inventory turnover Days sales outstanding (DSO) Fixed assets turnover Total assets turnover Debt-to-capital ratio -- TIE Operating margin Profit margin Basic earning power ROA ROE ROIC Price/earnings / Market/book Book value per share 1.2x 0.4% 4.7x 38.2 6.4x 2.1x 73.4% -1.0% -2.2% -2.7% -4.6% -5.6% -32.5% -4.2% -1.4% 0.5x $4.93 23x 0.8 x 4.8% 37.4 10.0 x 2.3 44.1% 4.3 x 5.5% 2.6% 13.0% 6.0% 13.3% 9.6% 9.7x 1.3 x $6.64 jdg #$ % Industry Average 2.7 x 1.0 x 6.1 x 320 7.0x 2.6% 40.0% 6.2 x 7.39 3.596 19.196 9.196 18.2% 14596 142x 2.4x n.a. Note: E indicates estimated. The 2017 data are forecasts. Calculation is based on a 365-day year
Step by Step Solution
There are 3 Steps involved in it

Get step-by-step solutions from verified subject matter experts