

Question: Interactive: Dynamic Figure 2.6.4 V=1 ne y = COS (8) -1t powered by desmos he dynamic figure shows the graph for each function y =
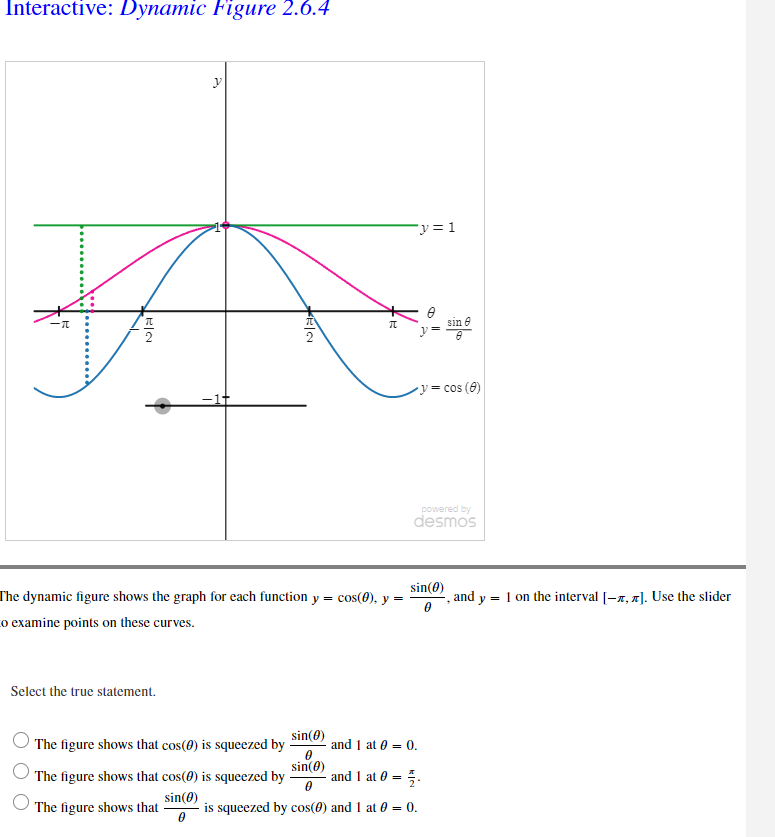

Interactive: Dynamic Figure 2.6.4 V=1 ne y = COS (8) -1t powered by desmos he dynamic figure shows the graph for each function y = cos(0), y = - sin(@) -, and y = 1 on the interval [-x, x]. Use the slider o examine points on these curves. Select the true statement. The figure shows that cos(0) is squeezed by - sin(0) - and 1 at 0 = 0. The figure shows that cos(0) is squeezed by- sin(0) - and 1 at 0 = = The figure shows that sin(@) is squeezed by cos(0) and 1 at 0 = 0
Step by Step Solution
There are 3 Steps involved in it
1 Expert Approved Answer
Step: 1 Unlock

Question Has Been Solved by an Expert!
Get step-by-step solutions from verified subject matter experts
Step: 2 Unlock
Step: 3 Unlock