

Question: Interactive Statistics Q.13.27 13.27 The following table gives the midterm exam score, x, and the final exam score, y, for a sample of 10 students
Interactive Statistics Q.13.27
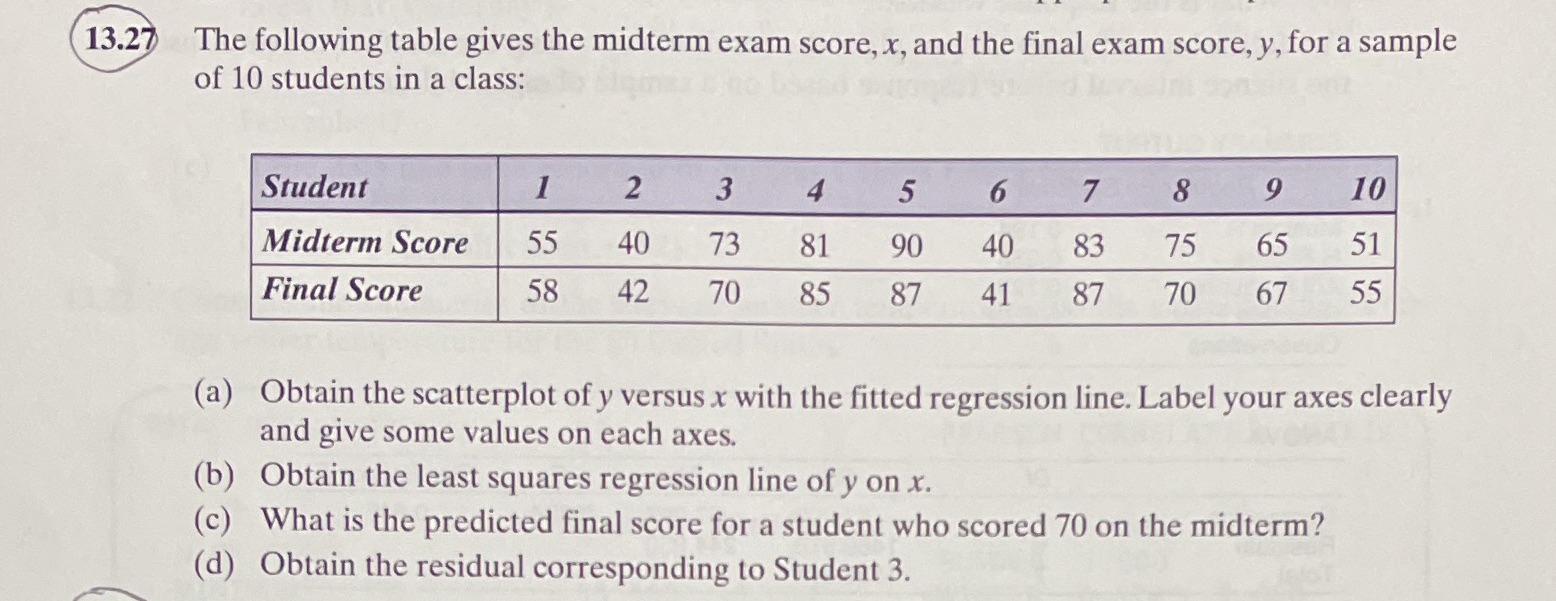
13.27 The following table gives the midterm exam score, x, and the final exam score, y, for a sample of 10 students in a class: Student 2 3 4 5 6 7 8 9 10 Midterm Score 55 40 73 81 90 40 83 75 65 51 Final Score 58 42 70 85 87 41 87 70 67 55 (a) Obtain the scatterplot of y versus x with the fitted regression line. Label your axes clearly and give some values on each axes. (b) Obtain the least squares regression line of y on x. (c) What is the predicted final score for a student who scored 70 on the midterm? (d) Obtain the residual corresponding to Student 3
Step by Step Solution
There are 3 Steps involved in it
1 Expert Approved Answer
Step: 1 Unlock

Question Has Been Solved by an Expert!
Get step-by-step solutions from verified subject matter experts
Step: 2 Unlock
Step: 3 Unlock