

Question: Interactive Statistics Q.4.33 4.33 Data on the amount of time (rounded to the nearest second) that 31 randomly selected cus- tomers spent in line before
Interactive Statistics Q.4.33
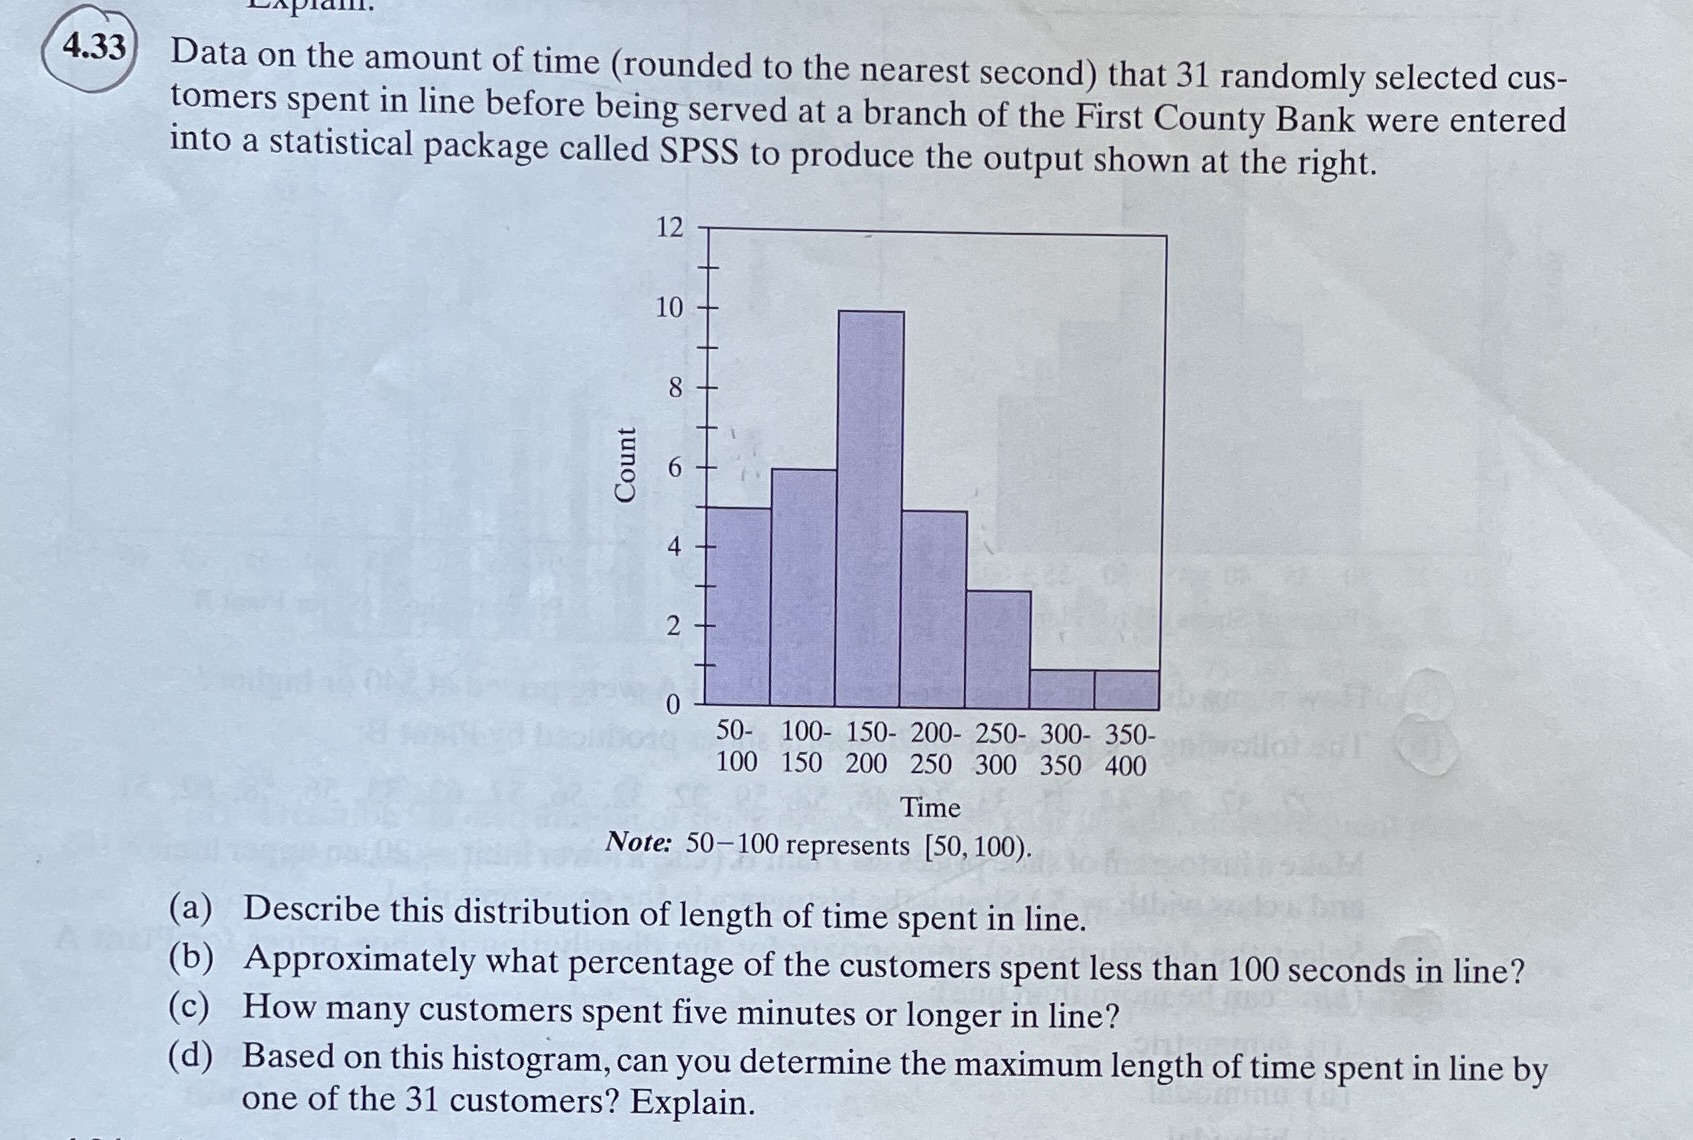
4.33 Data on the amount of time (rounded to the nearest second) that 31 randomly selected cus- tomers spent in line before being served at a branch of the First County Bank were entered into a statistical package called SPSS to produce the output shown at the right. 12 10 8 Count 6 4 N O 50- 100- 150- 200- 250- 300- 350- 100 150 200 250 300 350 400 Time Note: 50-100 represents [50, 100). (a) Describe this distribution of length of time spent in line. (b) Approximately what percentage of the customers spent less than 100 seconds in line? (c) How many customers spent five minutes or longer in line? (d) Based on this histogram, can you determine the maximum length of time spent in line by one of the 31 customers? Explain
Step by Step Solution
There are 3 Steps involved in it

Get step-by-step solutions from verified subject matter experts