

Question: Interpert the graph. Wjat does the chiice of constant versus risk-adjusted hurdel rates imply for Chestnut Food's resource-allocation strategy? EXHIBIT 14.1 I Value of $1.00
Interpert the graph. Wjat does the chiice of constant versus risk-adjusted hurdel rates imply for Chestnut Food's resource-allocation strategy?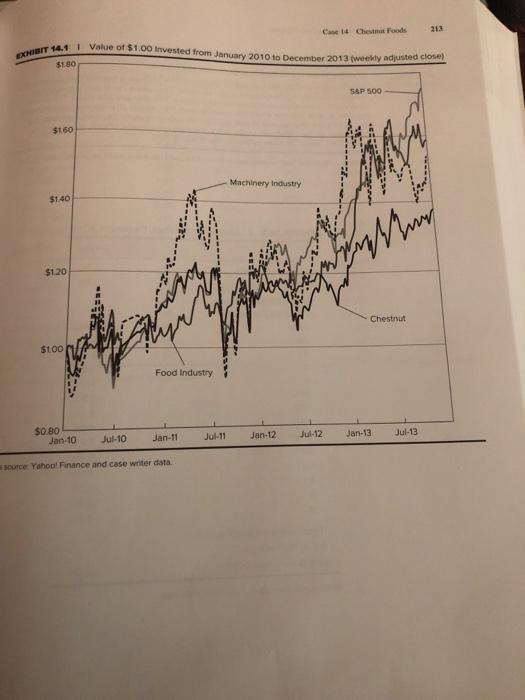
EXHIBIT 14.1 I Value of $1.00 Invested from January 2010 to December 2013 (weekly adjusted close) Cane 14 Chestmat Foods 213 $1.80 SAP 00 $1.60 Machinery Industry $1.40 $1.20 Chestrut $1.00 Food Industry $0.80 Jan-10 Jul-10 Jan-11 Jul-11 Jan-12 Jul-12 Jan-13 Jul-13 source Yahoo! Finance and case writer data
Step by Step Solution
3.42 Rating (152 Votes )
There are 3 Steps involved in it
Chestnut foods hurdle rate as of December 2013 70 Chestnut uses a ... View full answer

Get step-by-step solutions from verified subject matter experts