

Question: interpret coca-cola companys each ratio based on each ratio given picture below. thanks interpret each ratio (what does each ratio tell us) for coca cola
interpret coca-cola companys each ratio based on each ratio given picture below. thanks
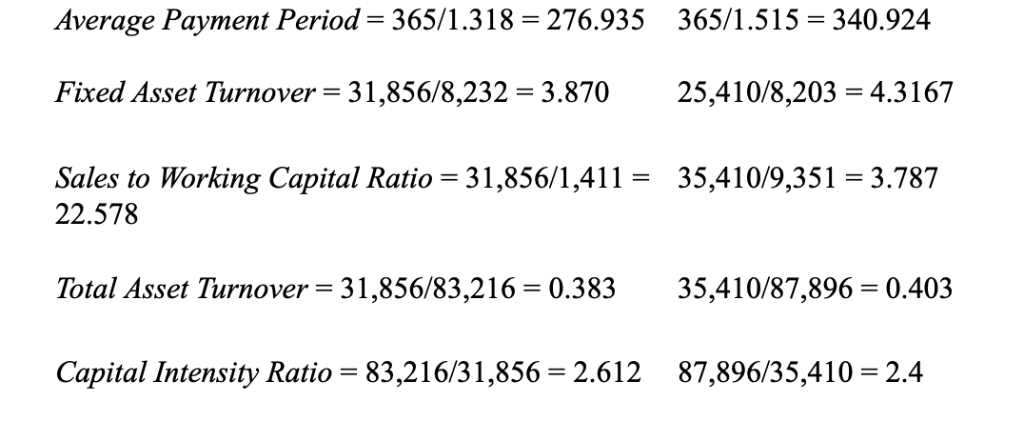
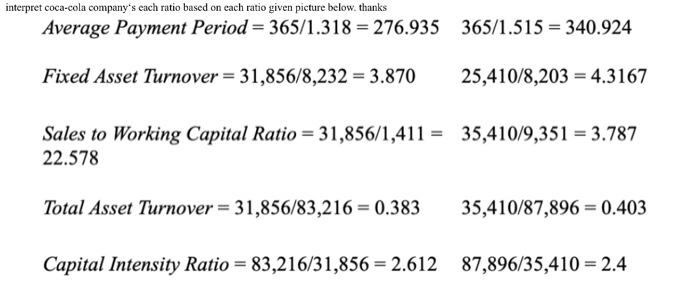
Average Payment Period 365/1.318 276.935 365/1.515 340.924 Fixed Asset Turnover 31,856/8,232-3.87025,410/8,203 4.3167 Sales to Working Capital Ratio - 31,856/1,411- 35,410/9,351- 3.78'7 22.578 Total Asset Turnover-31,856/83,216 0.383 35,410/87,896- 0.403 Capital Intensity Ratio 83,216/31,856-2.612 87,896/35,410-2.4 interpret coca-cola company's each ratio based on each ratio given picture below. thanks Average Payment Period- 365/1.318 276.935 365/1.515 340.924 Fixed Asset Turnover-31,856/8,232-3.870 25,410/8,203-4.3167 Sales to Working Capital Ratio = 31,856/1,411-35,410/9,351 = 3.787 22.578 Total Asset Turnover 31,856/83,216 0.38335,410/87,896 0.403 Capital Intensity Ratio 83,216/31,856-2.612 87,896/35,410-2.4
Step by Step Solution
There are 3 Steps involved in it

Get step-by-step solutions from verified subject matter experts