

Question: Interpret each financial statement of Nike separately by going through different section of each financial statement. Then explain within the interpretation how certain aspects could
Interpret each financial statement of Nike separately by going through different section of each financial statement. Then explain within the interpretation how certain aspects could have an effect on the companys stakeholders and shareholders and why.
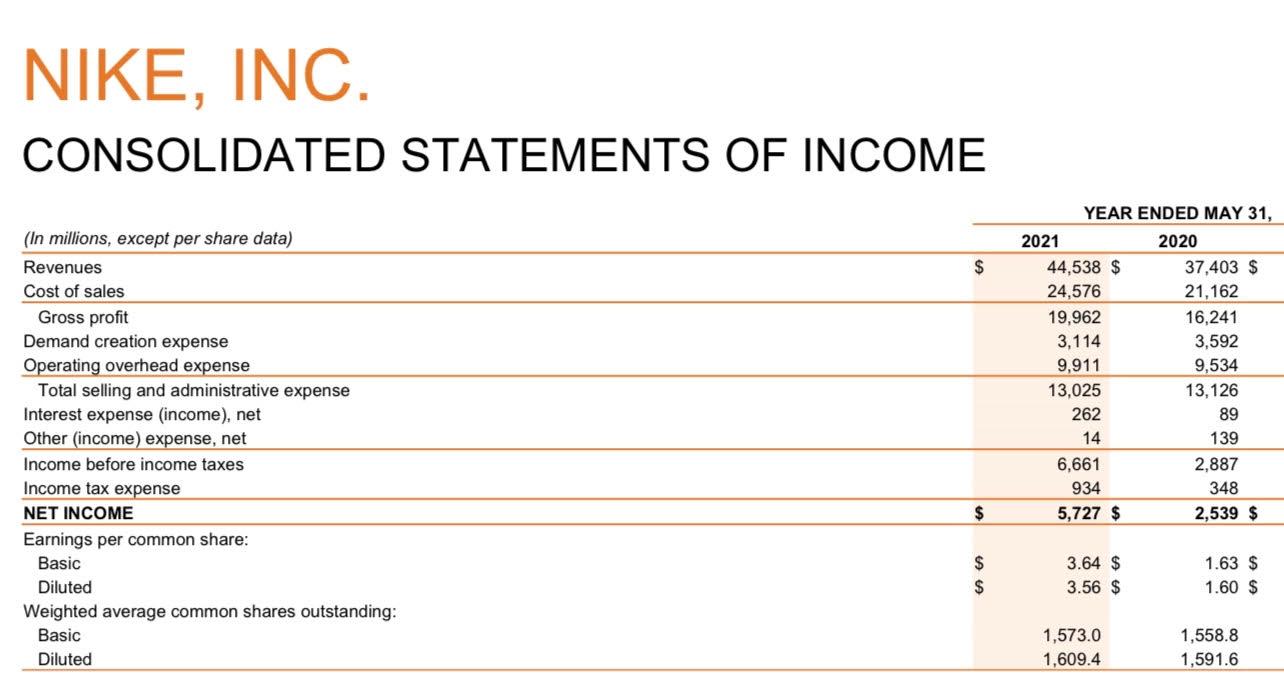
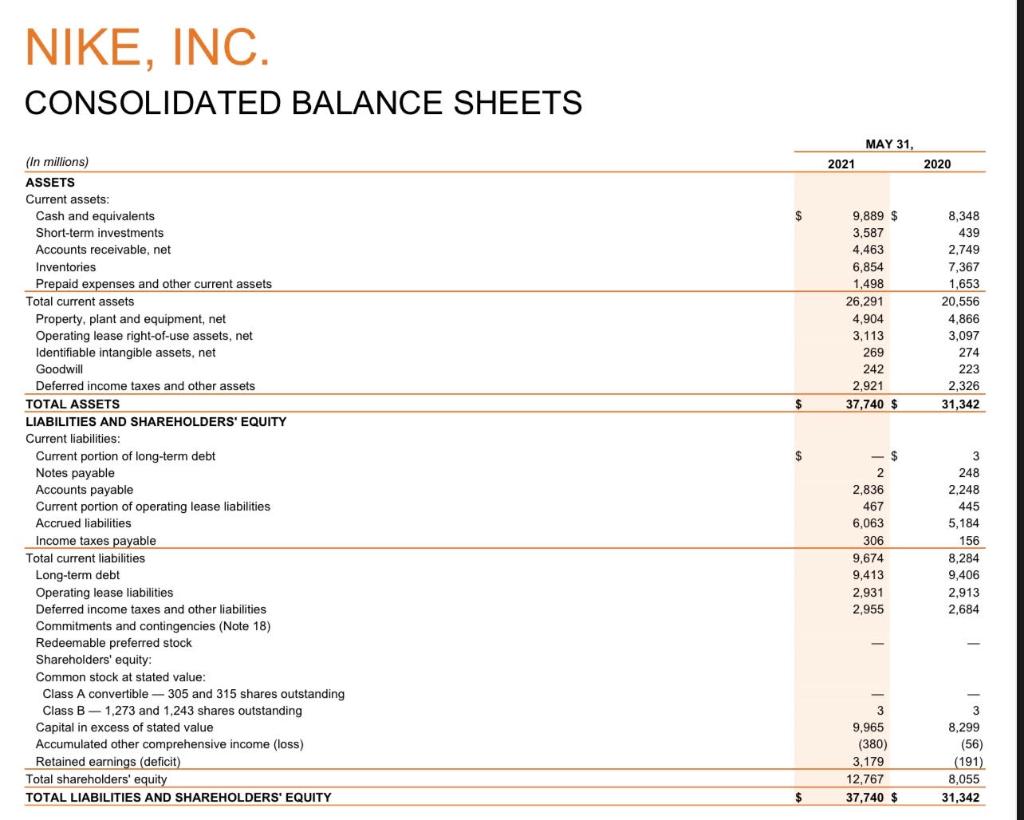
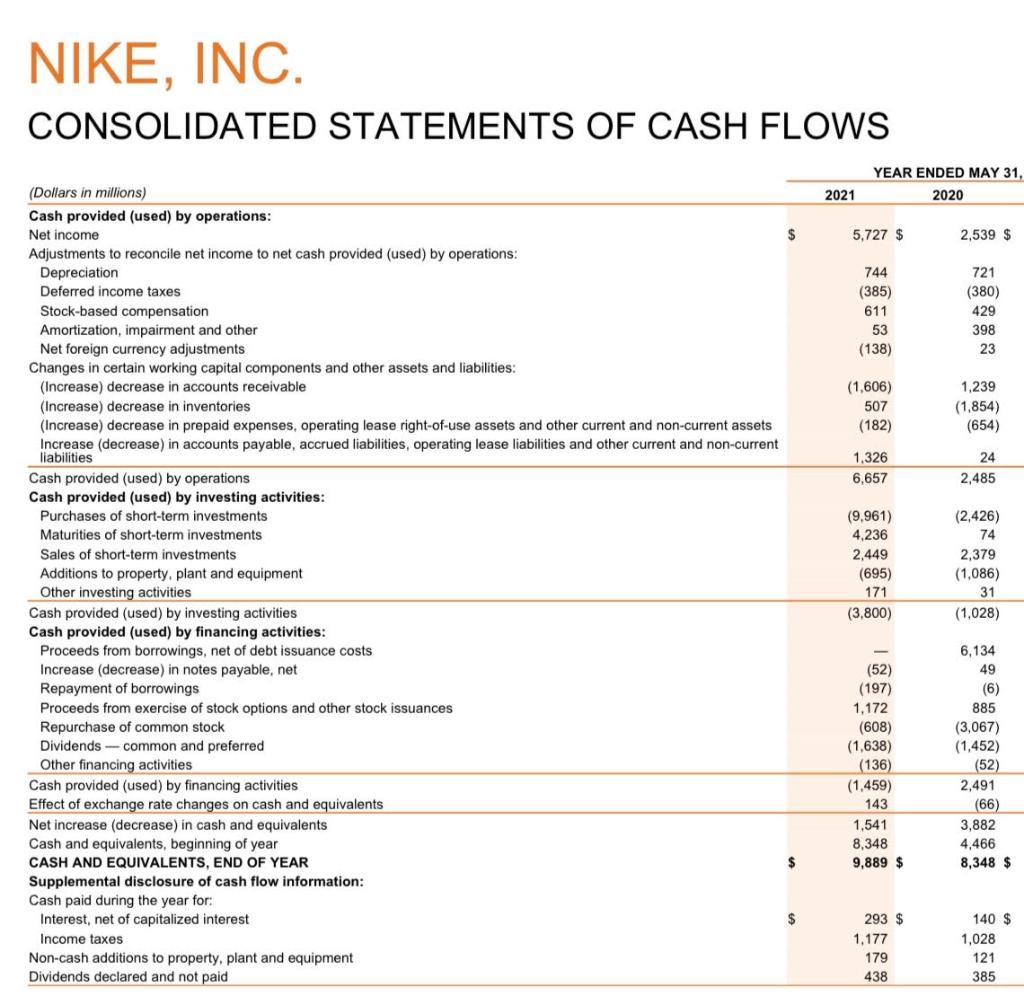
NIKE, INC. CONSOLIDATED STATEMENTS OF INCOME $ (In millions, except per share data) Revenues Cost of sales Gross profit Demand creation expense Operating overhead expense Total selling and administrative expense Interest expense (income), net Other (income) expense, net Income before income taxes Income tax expense NET INCOME Earnings per common share: Basic Diluted Weighted average common shares outstanding: Basic Diluted YEAR ENDED MAY 31, 2021 2020 44,538 $ 37,403 $ 24,576 21,162 19,962 16,241 3,114 3,592 9,911 9,534 13,025 13,126 262 89 14 139 6,661 2.887 934 348 5,727 $ 2,539 $ $ $ $ 3.64 $ 3.56 $ 1.63 $ 1.60 $ 1,573.0 1,609.4 1,558.8 1.591.6 NIKE, INC. CONSOLIDATED BALANCE SHEETS MAY 31, 2020 2021 $ 9,889 $ 3,587 4,463 6,854 1,498 26,291 4,904 3,113 269 242 2,921 37,740 $ 8,348 439 2,749 7,367 1,653 20.556 4,866 3,097 274 223 2,326 31,342 $ $ $ (In millions) ASSETS Current assets: Cash and equivalents Short-term investments Accounts receivable, net Inventories Prepaid expenses and other current assets Total current assets Property, plant and equipment, net Operating lease right-of-use assets, net Identifiable intangible assets, net Goodwill Deferred income taxes and other assets TOTAL ASSETS LIABILITIES AND SHAREHOLDERS' EQUITY Current liabilities: Current portion of long-term debt Notes payable Accounts payable Current portion of operating lease liabilities Accrued liabilities Income taxes payable Total current liabilities Long-term debt Operating lease liabilities Deferred income taxes and other liabilities Commitments and contingencies (Note 18) Redeemable preferred stock Shareholders' equity: Common stock at stated value: Class convertible - 305 and 315 shares outstanding Class B - 1,273 and 1.243 shares outstanding Capital in excess of stated value Accumulated other comprehensive income (loss) Retained earnings (deficit) Total shareholders' equity TOTAL LIABILITIES AND SHAREHOLDERS' EQUITY 2,836 467 6,063 306 9,674 9,413 2,931 2,955 3 248 2,248 445 5,184 156 8,284 9,406 2,913 2,684 9,965 (380) 3,179 12,767 37,740 $ 8,299 (56) (191) 8,055 31,342 $ NIKE, INC. CONSOLIDATED STATEMENTS OF CASH FLOWS YEAR ENDED MAY 31 2020 2021 $ 5,727 $ 2,539 $ 744 (385) 611 53 (138) 721 (380) 429 398 23 (1,606) 507 (182) 1,239 (1,854) (654) 1.326 6,657 24 2,485 (Dollars in millions) Cash provided (used) by operations: Net income Adjustments to reconcile net income to net cash provided (used) by operations: Depreciation Deferred income taxes Stock-based compensation Amortization, impairment and other Net foreign currency adjustments Changes in certain working capital components and other assets and liabilities: (Increase) decrease in accounts receivable (Increase) decrease in inventories (Increase) decrease in prepaid expenses, operating lease right-of-use assets and other current and non-current assets Increase (decrease) in accounts payable, accrued liabilities, operating lease liabilities and other current and non-current liabilities Cash provided (used) by operations Cash provided (used) by investing activities: Purchases of short-term investments Maturities of short-term investments Sales of short-term investments Additions to property, plant and equipment Other investing activities Cash provided (used) by investing activities Cash provided (used) by financing activities: Proceeds from borrowings, net of debt issuance costs Increase (decrease) in notes payable, net Repayment of borrowings Proceeds from exercise of stock options and other stock issuances Repurchase of common stock Dividends - common and preferred Other financing activities Cash provided (used) by financing activities Effect of exchange rate changes on cash and equivalents Net increase (decrease) in cash and equivalents Cash and equivalents, beginning of year CASH AND EQUIVALENTS, END OF YEAR Supplemental disclosure of cash flow information: Cash paid during the year for: Interest, net of capitalized interest Income taxes Non-cash additions to property, plant and equipment Dividends declared and not paid (9,961) 4,236 2,449 (695) 171 (3,800) (2,426) 74 2,379 (1,086) 31 (1,028) (52) (197) 1,172 (608) (1,638) (136) (1,459) 143 1,541 8,348 9,889 $ 6,134 49 (6) 885 (3,067) (1,452) (52) 2,491 (66) 3,882 4,466 8,348 $ $ $ 293 $ 1,177 179 438 140 $ 1,028 121 385 NIKE, INC. CONSOLIDATED STATEMENTS OF INCOME $ (In millions, except per share data) Revenues Cost of sales Gross profit Demand creation expense Operating overhead expense Total selling and administrative expense Interest expense (income), net Other (income) expense, net Income before income taxes Income tax expense NET INCOME Earnings per common share: Basic Diluted Weighted average common shares outstanding: Basic Diluted YEAR ENDED MAY 31, 2021 2020 44,538 $ 37,403 $ 24,576 21,162 19,962 16,241 3,114 3,592 9,911 9,534 13,025 13,126 262 89 14 139 6,661 2.887 934 348 5,727 $ 2,539 $ $ $ $ 3.64 $ 3.56 $ 1.63 $ 1.60 $ 1,573.0 1,609.4 1,558.8 1.591.6 NIKE, INC. CONSOLIDATED BALANCE SHEETS MAY 31, 2020 2021 $ 9,889 $ 3,587 4,463 6,854 1,498 26,291 4,904 3,113 269 242 2,921 37,740 $ 8,348 439 2,749 7,367 1,653 20.556 4,866 3,097 274 223 2,326 31,342 $ $ $ (In millions) ASSETS Current assets: Cash and equivalents Short-term investments Accounts receivable, net Inventories Prepaid expenses and other current assets Total current assets Property, plant and equipment, net Operating lease right-of-use assets, net Identifiable intangible assets, net Goodwill Deferred income taxes and other assets TOTAL ASSETS LIABILITIES AND SHAREHOLDERS' EQUITY Current liabilities: Current portion of long-term debt Notes payable Accounts payable Current portion of operating lease liabilities Accrued liabilities Income taxes payable Total current liabilities Long-term debt Operating lease liabilities Deferred income taxes and other liabilities Commitments and contingencies (Note 18) Redeemable preferred stock Shareholders' equity: Common stock at stated value: Class convertible - 305 and 315 shares outstanding Class B - 1,273 and 1.243 shares outstanding Capital in excess of stated value Accumulated other comprehensive income (loss) Retained earnings (deficit) Total shareholders' equity TOTAL LIABILITIES AND SHAREHOLDERS' EQUITY 2,836 467 6,063 306 9,674 9,413 2,931 2,955 3 248 2,248 445 5,184 156 8,284 9,406 2,913 2,684 9,965 (380) 3,179 12,767 37,740 $ 8,299 (56) (191) 8,055 31,342 $ NIKE, INC. CONSOLIDATED STATEMENTS OF CASH FLOWS YEAR ENDED MAY 31 2020 2021 $ 5,727 $ 2,539 $ 744 (385) 611 53 (138) 721 (380) 429 398 23 (1,606) 507 (182) 1,239 (1,854) (654) 1.326 6,657 24 2,485 (Dollars in millions) Cash provided (used) by operations: Net income Adjustments to reconcile net income to net cash provided (used) by operations: Depreciation Deferred income taxes Stock-based compensation Amortization, impairment and other Net foreign currency adjustments Changes in certain working capital components and other assets and liabilities: (Increase) decrease in accounts receivable (Increase) decrease in inventories (Increase) decrease in prepaid expenses, operating lease right-of-use assets and other current and non-current assets Increase (decrease) in accounts payable, accrued liabilities, operating lease liabilities and other current and non-current liabilities Cash provided (used) by operations Cash provided (used) by investing activities: Purchases of short-term investments Maturities of short-term investments Sales of short-term investments Additions to property, plant and equipment Other investing activities Cash provided (used) by investing activities Cash provided (used) by financing activities: Proceeds from borrowings, net of debt issuance costs Increase (decrease) in notes payable, net Repayment of borrowings Proceeds from exercise of stock options and other stock issuances Repurchase of common stock Dividends - common and preferred Other financing activities Cash provided (used) by financing activities Effect of exchange rate changes on cash and equivalents Net increase (decrease) in cash and equivalents Cash and equivalents, beginning of year CASH AND EQUIVALENTS, END OF YEAR Supplemental disclosure of cash flow information: Cash paid during the year for: Interest, net of capitalized interest Income taxes Non-cash additions to property, plant and equipment Dividends declared and not paid (9,961) 4,236 2,449 (695) 171 (3,800) (2,426) 74 2,379 (1,086) 31 (1,028) (52) (197) 1,172 (608) (1,638) (136) (1,459) 143 1,541 8,348 9,889 $ 6,134 49 (6) 885 (3,067) (1,452) (52) 2,491 (66) 3,882 4,466 8,348 $ $ $ 293 $ 1,177 179 438 140 $ 1,028 121 385
Step by Step Solution
There are 3 Steps involved in it

Get step-by-step solutions from verified subject matter experts