

Question: interpret the changes in Starbucks risk ratios during the three-year period indicating areas of concern. RISK FACTORS: 2012 Year 2008 2009 2010 2011 LIQUIDITY Current
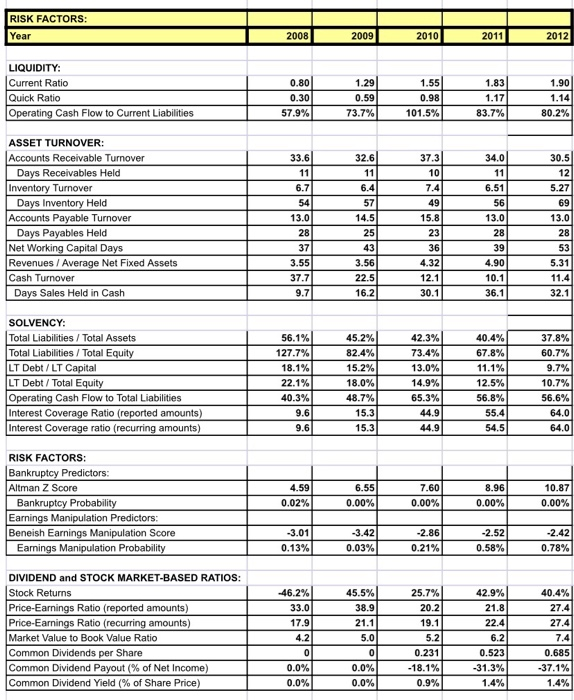
RISK FACTORS: 2012 Year 2008 2009 2010 2011 LIQUIDITY Current Ratio 0.80 1.29 1.55 1.83 1.90 Quick Ratio 0.30 0.59 0.98 1.17 1.14 Operating Cash Flow to Current Liabilities 57.9% 73.7% 101.5% 83.7% 80.2% ASSET TURNOVER: Accounts Receivable Turnover 34.0 33.6 32.6 37.3 30.5 Days Receivables Held 11 11 10 11 12 Inventory Turnover Days Inventory Held Accounts Payable Turnover 6.7 6.4 7.4 6.51 5.27 54 57 49 56 69 13.0 14.5 15.8 13.0 13.0 Days Payables Held Net Working Capital Days Revenues / Average Net Fixed Assets 28 25 23 28 28 37 43 36 39 53 3.55 3.56 4.32 4.90 5.31 Cash Turnover 37.7 22.5 12.1 10.1 11.4 Days Sales Held in Cash 9.7 16.2 30.1 36.1 32.1 SOLVENCY 45.2% 42.3% Total Liabilities/ Total Assets 56.1% 40.4% 37.8% Total Liabilities / Total Equity 127.7% 82.4% 73.4% 67.8% 60.7% LT Debt /LT Capital 18.1% 15.2% 13.0% 11.1% 9.7% LT Debt/Total Equity Operating Cash Flow to Total Liabilities Interest Coverage Ratio (reported amounts) Interest Coverage ratio (recurring amounts) 22.1 % 18.0% 14.9% 12.5% 10.7% 40.3% 48.7% 65.3% 56.8% 56.6% 9.6 15.3 44.9 55.4 64.0 9.6 15.3 44.9 54.5 64.0 RISK FACTORS: Bankruptcy Predictors: Altman Z Score 4.59 6.55 7.60 8.96 10.87 0.00% Bankruptcy Probability 0.02% 0.00 % 0.00% 0.00% Earnings Manipulation Predictors: Beneish Earnings Manipulation Score Earnings Manipulation Probability -3.01 3.42 -2.86 -2.52 -2.42 0.13% 0.03% 0.21% 0.58% 0.78% DIVIDEND and STOCK MARKET-BASED RATIOS: Stock Returns Price-Earnings Ratio (reported amounts) Price-Earnings Ratio (recurring amounts) Market Value to Book Value Ratio 46.2% 45.5% 25.7% 42.9% 40.4% 33.0 38.9 20.2 21.8 27.4 17.9 21.1 19.1 22.4 27.4 4.2 5.0 5.2 6.2 7.4 Common Dividends per Share C 0.231 0.523 0.685 Common Dividend Payout ( % of Net Income) Common Dividend Yield (% of Share Price) 0.0% 0.0% -18.1 % -31.3% -37.1% 0.9% 0.0% 0.0% 1.4% 1.4%
Step by Step Solution
There are 3 Steps involved in it

Get step-by-step solutions from verified subject matter experts