

Question: Interpret the data for number 2 using the spectroscopy interpretation flow chart Spectroscopy Interpretation Determine IHD from molecular formula IHD = sum of the pi-bonds
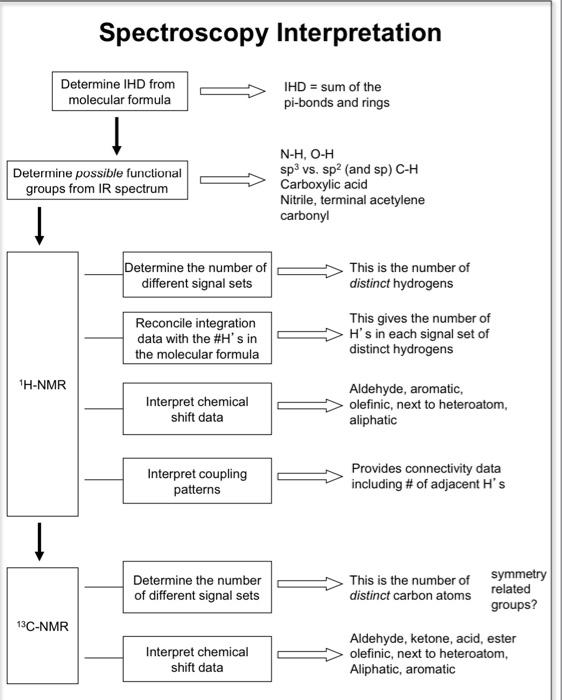
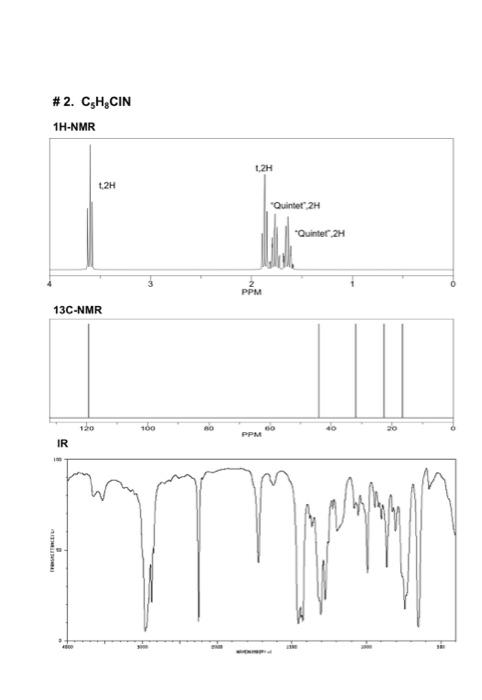
Spectroscopy Interpretation Determine IHD from molecular formula IHD = sum of the pi-bonds and rings Determine possible functional groups from IR spectrum N-H, O-H sp3 vs. sp2 (and sp) C-H Carboxylic acid Nitrile, terminal acetylene carbonyl 1 Determine the number of different signal sets This is the number of distinct hydrogens Reconcile integration data with the #H's in the molecular formula This gives the number of H's in each signal set of distinct hydrogens TH-NMR Interpret chemical shift data Aldehyde, aromatic, olefinic, next to heteroatom, aliphatic Interpret coupling patterns Provides connectivity data including # of adjacent H's 1 Determine the number of different signal sets This is the number of distinct carbon atoms symmetry related groups? 13C-NMR Interpret chemical shift data Aldehyde, ketone, acid, ester olefinic, next to heteroatom, Aliphatic, aromatic #2. C,H,CIN 1H-NMR L2H t2H "Quintet 2H "Quinter 2 PPM 13C-NMR 10 120 100 & PPM IR LEIL
Step by Step Solution
There are 3 Steps involved in it

Get step-by-step solutions from verified subject matter experts