

Question: Interpret the findings, are there significant differences .003 .004 Using the attached data set, answer the following questions. For both questions, you need to interpret
Interpret the findings, are there significant differences
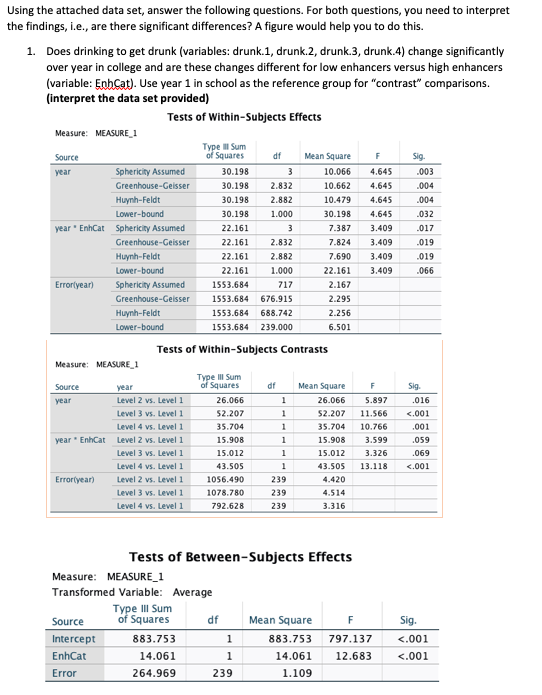
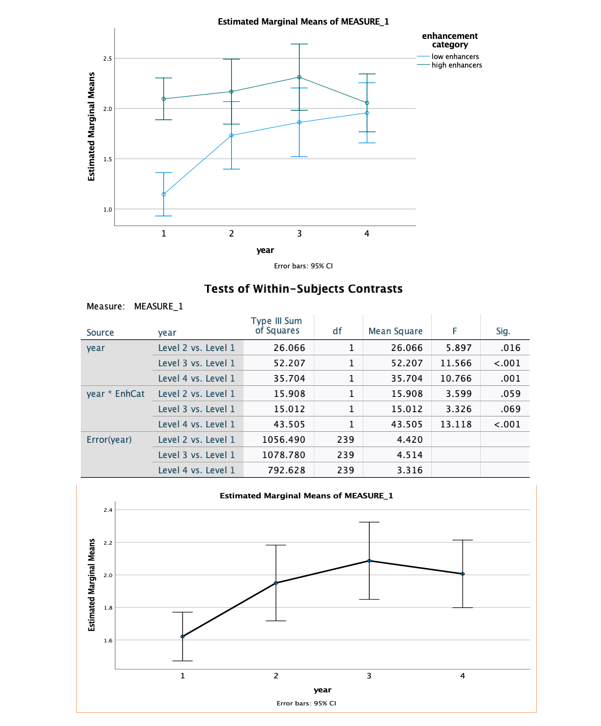
.003 .004 Using the attached data set, answer the following questions. For both questions, you need to interpret the findings, i.e., are there significant differences? A figure would help you to do this. 1. Does drinking to get drunk (variables: drunk.1, drunk.2, drunk.3, drunk. 4) change significantly over year in college and are these changes different for low enhancers versus high enhancers (variable: EnhCat). Use year 1 in school as the reference group for "contrasta comparisons. (interpret the data set provided) Tests of Within-Subjects Effects Measure: MEASURE 1 Type ll Sum Source of Squares df Mean Square F Sig year Sphericity Assumed 30.198 3 10.066 4.645 Greenhouse-Geisser 30.198 2.832 10.662 4.645 .004 | Huynh-Feldt 30.198 2.882 10.479 4.645 Lower-bound 30.198 1.000 30.198 4.645 .032 year " Enhcat Spherichy Assumed 22.161 3 7.387 3.409 .017 Greenhouse-Geisser 22.161 2.832 7.824 3.409 .019 Huynh Feldt 22.161 2.882 7.690 3.409 .019 Lower-bound 22.161 1.000 22.161 3.409 .066 Errorlyear) Sphericity Assumed 1553.684 717 2.167 Greenhouse-Geisser 1553.684 676.915 2.295 Huynh-Feldt 1553.684 688.742 2.256 Lower-bound 1553.684 239.000 6.501 Tests of Within-Subjects Contrasts Measure: MEASURE_1 Type Ill Sum year of Squares df Mean Square F Sig Level 2 vs. Level 1 26.066 1 26.066 5.897 .016 Level 3 vs. Level 1 52.207 1 $2.207 11.566 <.001 level vs. .001 year enhcat .059 .069 errortyear source tests of between-subjects effects measure: measure_1 transformed variable: average type iii sum squares df mean square intercept error sig. estimated marginal means enhancement category enhancers high h i f bars: ci within-subjects contrasts .016 errer .003 .004 using the attached data set answer following questions. for both questions you need to interpret findings i.e. are there significant differences a figure would help do this. does drinking get drunk drunk.1 drunk.2 drunk.3 drunk. change significantly over in college and these changes different low versus use school as reference group comparisons. provided measure ll sig sphericity assumed greenhouse-geisser huynh-feldt lower-bound .032 spherichy .017 .019 huynh feldt .066 errorlyear ill>
Step by Step Solution
There are 3 Steps involved in it

Get step-by-step solutions from verified subject matter experts