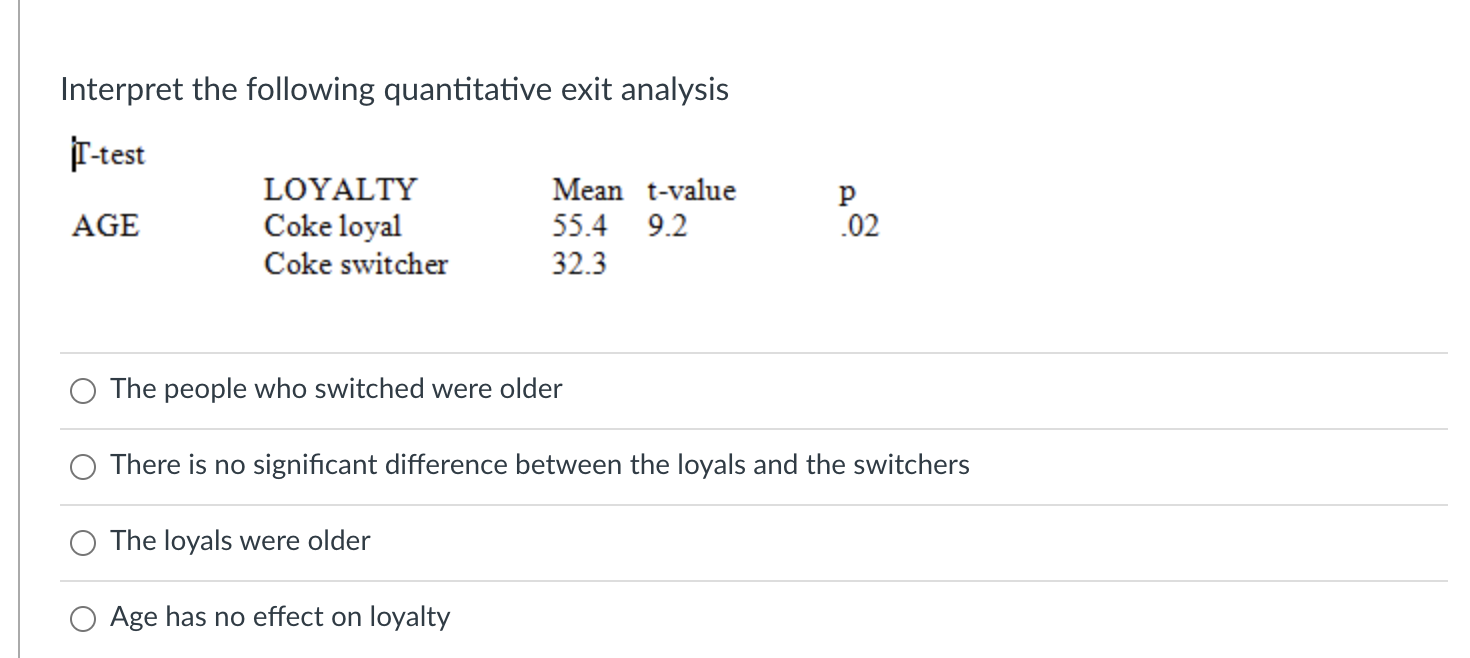
Question: Interpret the following quantitative exit analysis IT-test LOYALTY Mean t-value AGE Coke loyal 55.4 9.2 Coke switcher 32.3 p .02 The people who switched were

Interpret the following quantitative exit

Interpret the following quantitative exit analysis IT-test LOYALTY Mean t-value AGE Coke loyal 55.4 9.2 Coke switcher 32.3 p .02 The people who switched were older There is no significant difference between the loyals and the switchers The loyals were older Age has no effect on loyalty

Step by Step Solution

There are 3 Steps involved in it

1 Expert Approved Answer
Step: 1 Unlock blur-text-image
Question Has Been Solved by an Expert!

Get step-by-step solutions from verified subject matter experts

Step: 2 Unlock
Step: 3 Unlock

Students Have Also Explored These Related General Management Questions!