

Question: -Interpret the information from the analysis using the Simple Variance Analysis Interpretation as reference: Actual Results Variance Amount Variance % Simple Budget I. Volume (Number
-Interpret the information from the analysis using the "Simple Variance Analysis Interpretation" as reference:
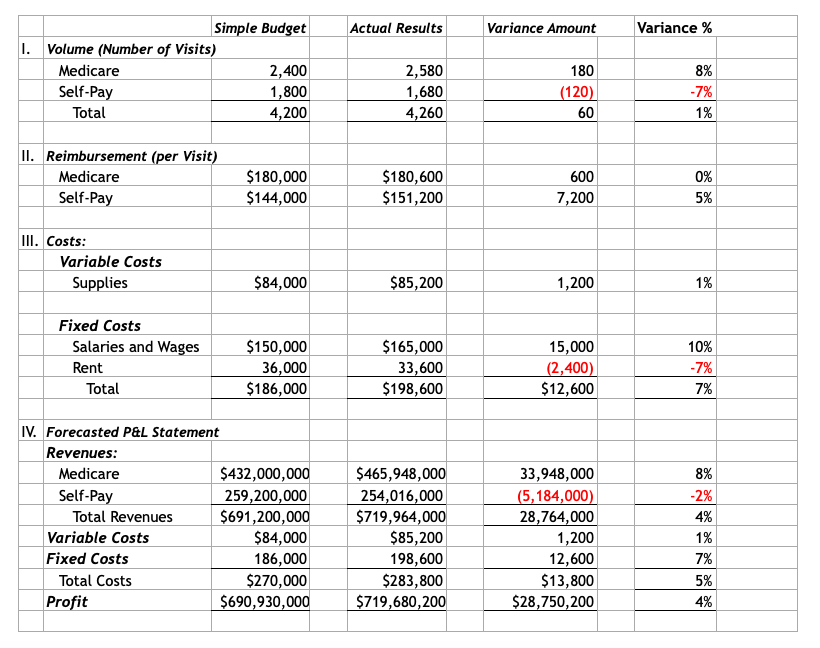
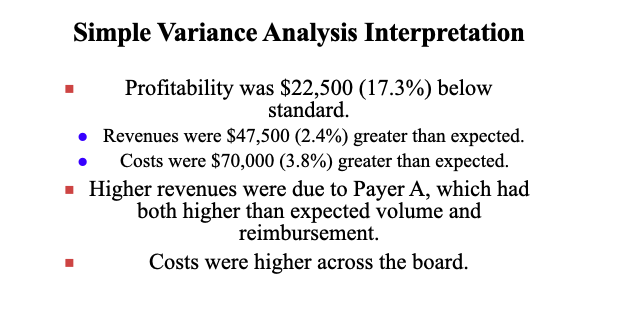
Actual Results Variance Amount Variance % Simple Budget I. Volume (Number of Visits) Medicare 2,400 Self-Pay 1,800 Total 4,200 2,580 1,680 4,260 180 (120) 8% -7% 1% 60 II. Reimbursement (per Visit) Medicare Self-Pay $180,000 $144,000 $180,600 $151,200 600 7,200 0% 5% III. Costs: Variable Costs Supplies $84,000 $85,200 1,200 1% Fixed Costs Salaries and Wages Rent Total $150,000 36,000 $186,000 $165,000 33,600 $198,600 15,000 (2,400) $12,600 10% -7% 7% IV. Forecasted P&L Statement Revenues: Medicare $432,000,000 Self-Pay 259,200,000 Total Revenues $691,200,000 Variable Costs $84,000 Fixed Costs 186,000 Total Costs $270,000 Profit $690,930,000 $465,948,000 254,016,000 $719,964,000 $85,200 198,600 $283,800 $719,680,200 33,948,000 (5,184,000) 28,764,000 1,200 12,600 $13,800 $28,750,200 8% -2% 4% 1% 7% 5% 4% Simple Variance Analysis Interpretation Profitability was $22,500 (17.3%) below standard. Revenues were $47,500 (2.4%) greater than expected. Costs were $70,000 (3.8%) greater than expected. Higher revenues were due to Payer A, which had both higher than expected volume and reimbursement. Costs were higher across the board
Step by Step Solution
There are 3 Steps involved in it

Get step-by-step solutions from verified subject matter experts