

Question: Interpret the pattern of mean differences in self-esteem scores between the weight status groups.Did the results of the ANOVA support the research hypothesis for the
Interpret the pattern of mean differences in self-esteem scores between the weight status groups.Did the results of the ANOVA support the research hypothesis for the main effect of the weight status group?(Research Hypothesis: Mnormal weight> Moverweight > Mobese)
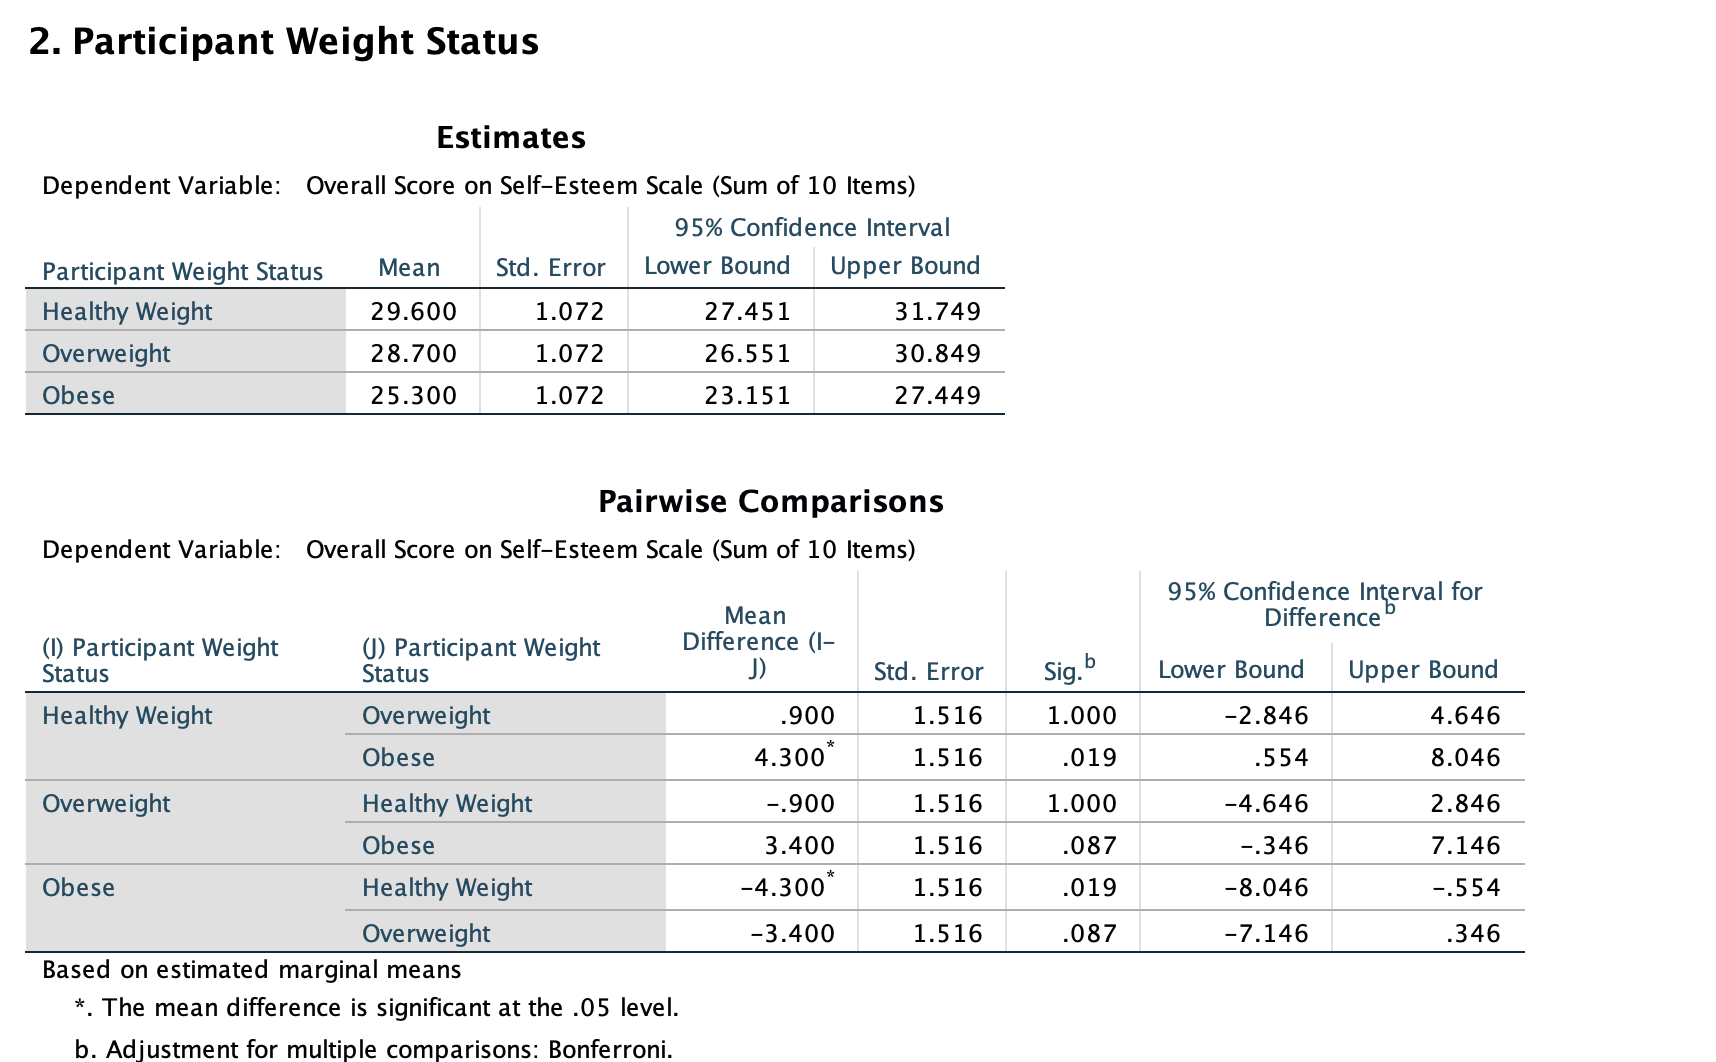
2. Participant Weight Status Estimates Dependent Variable: Overall Score on SelfEsteem Scale (Sum of 10 Items) 95% Condence Interval Participant weight Status Mean Std. Error Lower Bound Healthy Weight 29.600 1.072 27.451 Ovemeight 28.700 1.072 26.551 Obese 25.300 1.072 23.151 Upper Bound 31.749 30.849 27.449 Pairwise Comparisons Dependent Variable: Overall Score on SelfEsteem Scale (Sum of 10 Items) 95% Condence Interval for Mean Difference (I) Participant Weight (J) Participant Weight Difference (' Status Status J) Std. Error Sig.b Lower Bound Upper Bound Healthy Weight Overweight .900 1.516 1.000 2.846 4.646 Obese 4.300? 1.516 .019 .554 8.046 Oveniveight Healthy Weight .900 1.516 1.000 4.646 2.846 Obese 3.400 1.516 .087 .346 7.146 Obese Healthy Weight 4.300* 1.516 .019 8.046 .5 54 Overweight 3.400 1.516 .087 7.146 .346 Based on estimated marginal means *. The mean difference is signicant at the .05 level. b. Adjustment for multiple comparisons: Bonferroni
Step by Step Solution
There are 3 Steps involved in it

Get step-by-step solutions from verified subject matter experts