

Question: Interpret the pattern of results for interaction using the line plotand bar graph figure generated in the SPSS output. Explain if the results of the
Interpret the pattern of results for interaction using the line plotand bar graph figure generated in the SPSS output. Explain if the results of the interaction support the research hypothesis for the interaction?
(Research Hypothesis: Females: Mhealthyweight > Moverweight> Mobese; Males: Mhealthyweight = Moverweight > Mobese)
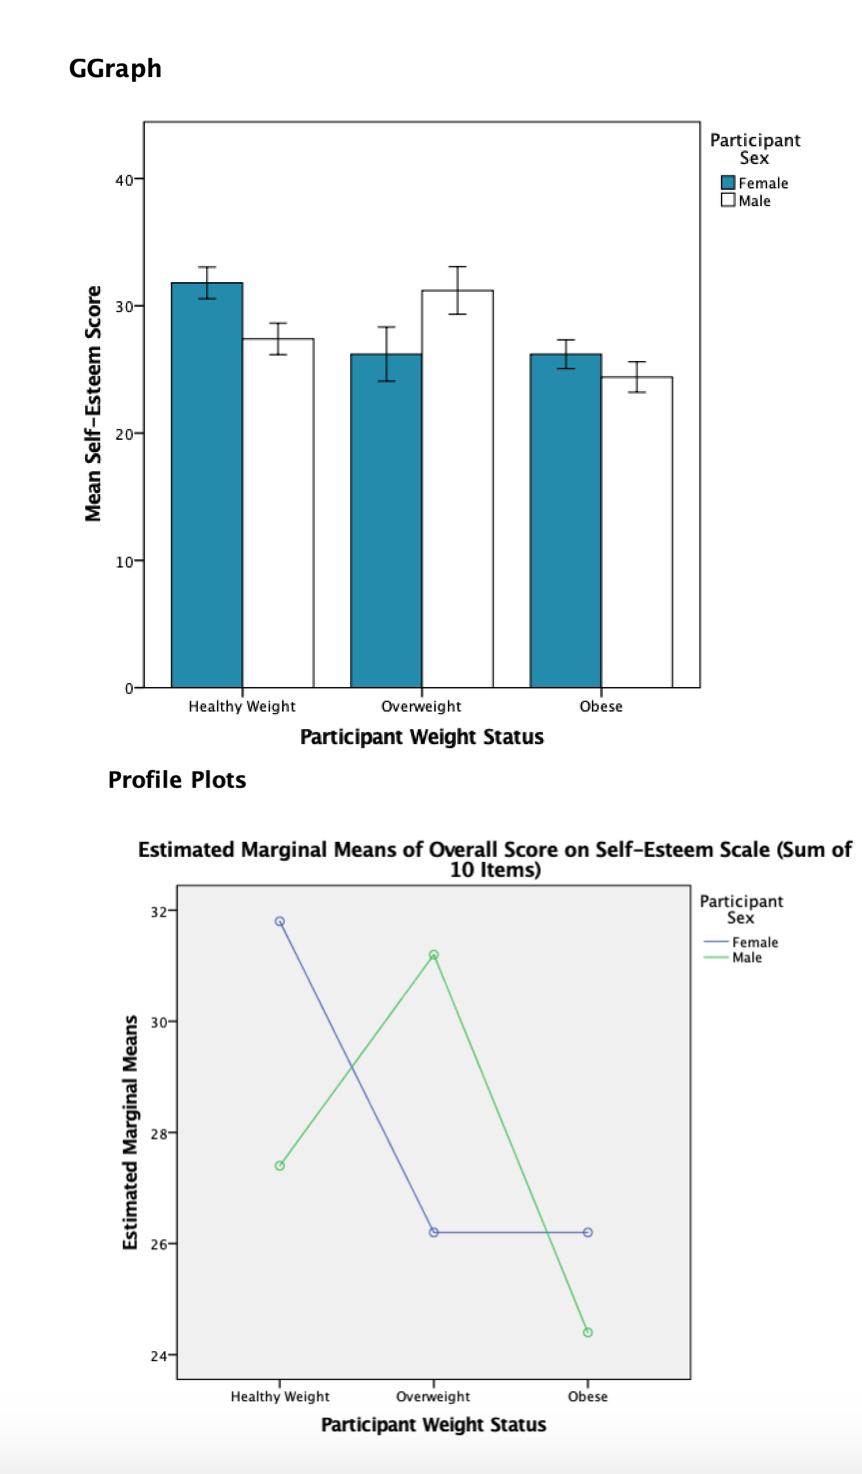
GGraph Participant Sex 40- Female OMale Mean Self-Esteem Score 30- 20- 10- Healthy Weight Overweight Obese Participant Weight Status Profile Plots Estimated Marginal Means of Overall Score on Self-Esteem Scale (Sum of 10 Items) 32- Participant Sex X Female . Male Estimated Marginal Means 30- 28- 26- 24- Healthy Weight Overweight Obese Participant Weight Status
Step by Step Solution
There are 3 Steps involved in it

Get step-by-step solutions from verified subject matter experts