

Question: Interpret the results Scenario Analysis Increase in unit sales 15% Increase in sale price 5% Increase in WC 5% Cost of goods sold remains at
Interpret the results
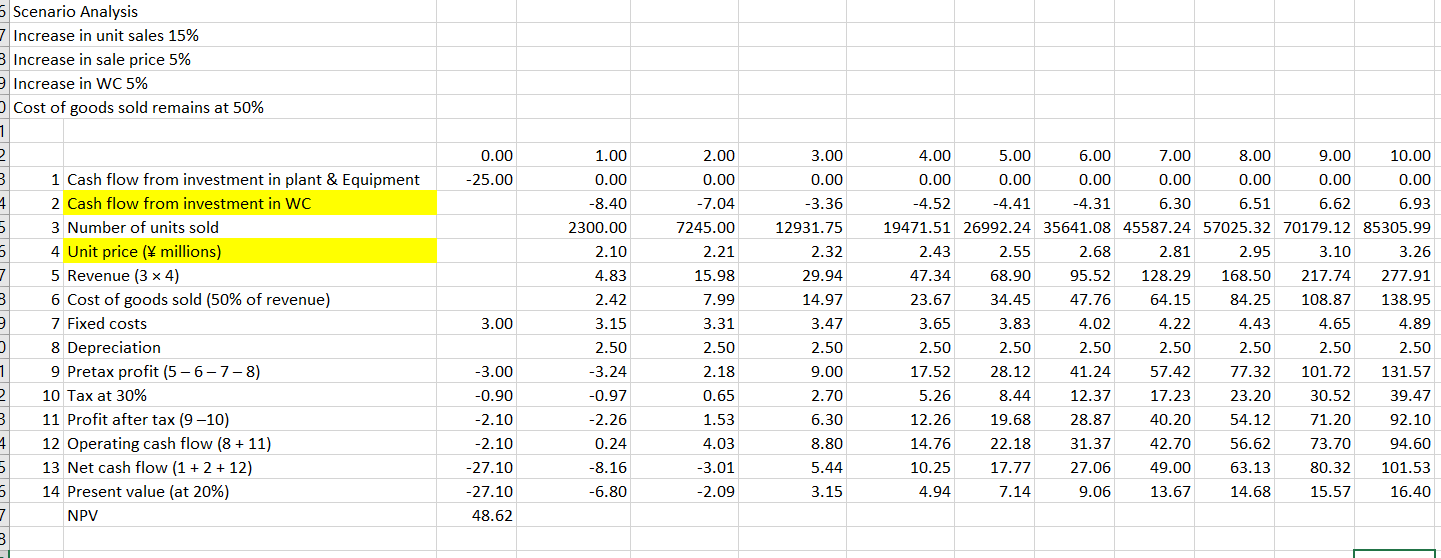
Scenario Analysis Increase in unit sales 15% Increase in sale price 5% Increase in WC 5\% Cost of goods sold remains at 50% 1 Cash flow from investment in plant \& Equipment 2 Cash flow from investment in WC 3 Number of units sold 4 Unit price ( millions) 5 Revenue (34) 6 Cost of goods sold ( 50% of revenue) 7 Fixed costs 8 Depreciation 9 Pretax profit (5678) 10 Tax at 30% 11 Profit after tax (910) 12 Operating cash flow (8+11) 13 Net cash flow (1+2+12) 14 Present value (at 20\%) NPV 0.00 25.00 1.00 0.00 8.40 2300.00 2.10 4.83 2.42 3.15 2.50 3.24 3.00 0.90 2.10 2.10 27.10 27.10 48.62 2.00 0.00 7.04 7245.00 2.21 15.98 7.99 3.31 2.50 2.18 -0.97 -2.26 0.24 8.16 6.80 3.00 0.00 3.36 12931.75 19471.51 2.32 2.32 29.94 14.97 3.47 2.50 9.00 4.00 0.00 5.00 4.41 \begin{tabular}{|l|l|} 26992.24 & 35641.08 \end{tabular} \begin{tabular}{|r|r|} 26992.24 & 35641.08 \\ \hline 2.55 & 2.68 \end{tabular} 6.00 0.000.00 \begin{tabular}{|r|r|r|} 0.00 & 0.00 \\ \hline-4.31 & 6.30 \\ \hline \end{tabular} 2.70 45587.24 2.81 57025.32 2.68 95.52 2.95 47.34 68.90 47.76 64.15 168.50 3.65 3.83 4.02 4.22 17.52 28.12 41.24 57.42 5.26 8.44 12.37 57.42 17.23 8.80 5.44 14.76 19.68 22.18 3.15 10.25 4.94 17.77 7.14 31.37 40.20 \begin{tabular}{|r|r|r|} 84.25 & 108.87 & 138.95 \\ \hline 4.43 & 4.65 & 4.89 \\ \hline 2.50 & 2.50 & 2.50 \\ \hline \end{tabular} \begin{tabular}{|l|r|r|} \hline 77.32 & 101.72 & 131.57 \\ \hline 23.20 & 30.52 & 39.47 \\ \hline \end{tabular} \begin{tabular}{|l|l|l|} \hline 23.20 & 30.52 & 39.47 \\ \hline 54.12 & 71.20 & 92.10 \\ \hline \end{tabular} \begin{tabular}{|l|r|r|} \hline 56.62 & 73.70 & 94.60 \\ \hline 63.13 & 80.32 & 101.53 \\ \hline \end{tabular} \begin{tabular}{|r|r|r|} \hline 56.62 & 73.70 & 94.60 \\ \hline 63.13 & 80.32 & 101.53 \\ \hline 14.68 & 15.57 & 16.40 \\ \hline \end{tabular} 9.06 \begin{tabular}{|r|r|r|r|} \hline 49.00 & 63.13 & 80.32 & 101.53 \\ \hline 13.67 & 14.68 & 15.57 & 16.40 \\ \hline & & & \\ \hline & & & \\ \hline \end{tabular} Scenario Analysis Increase in unit sales 15% Increase in sale price 5% Increase in WC 5\% Cost of goods sold remains at 50% 1 Cash flow from investment in plant \& Equipment 2 Cash flow from investment in WC 3 Number of units sold 4 Unit price ( millions) 5 Revenue (34) 6 Cost of goods sold ( 50% of revenue) 7 Fixed costs 8 Depreciation 9 Pretax profit (5678) 10 Tax at 30% 11 Profit after tax (910) 12 Operating cash flow (8+11) 13 Net cash flow (1+2+12) 14 Present value (at 20\%) NPV 0.00 25.00 1.00 0.00 8.40 2300.00 2.10 4.83 2.42 3.15 2.50 3.24 3.00 0.90 2.10 2.10 27.10 27.10 48.62 2.00 0.00 7.04 7245.00 2.21 15.98 7.99 3.31 2.50 2.18 -0.97 -2.26 0.24 8.16 6.80 3.00 0.00 3.36 12931.75 19471.51 2.32 2.32 29.94 14.97 3.47 2.50 9.00 4.00 0.00 5.00 4.41 \begin{tabular}{|l|l|} 26992.24 & 35641.08 \end{tabular} \begin{tabular}{|r|r|} 26992.24 & 35641.08 \\ \hline 2.55 & 2.68 \end{tabular} 6.00 0.000.00 \begin{tabular}{|r|r|r|} 0.00 & 0.00 \\ \hline-4.31 & 6.30 \\ \hline \end{tabular} 2.70 45587.24 2.81 57025.32 2.68 95.52 2.95 47.34 68.90 47.76 64.15 168.50 3.65 3.83 4.02 4.22 17.52 28.12 41.24 57.42 5.26 8.44 12.37 57.42 17.23 8.80 5.44 14.76 19.68 22.18 3.15 10.25 4.94 17.77 7.14 31.37 40.20 \begin{tabular}{|r|r|r|} 84.25 & 108.87 & 138.95 \\ \hline 4.43 & 4.65 & 4.89 \\ \hline 2.50 & 2.50 & 2.50 \\ \hline \end{tabular} \begin{tabular}{|l|r|r|} \hline 77.32 & 101.72 & 131.57 \\ \hline 23.20 & 30.52 & 39.47 \\ \hline \end{tabular} \begin{tabular}{|l|l|l|} \hline 23.20 & 30.52 & 39.47 \\ \hline 54.12 & 71.20 & 92.10 \\ \hline \end{tabular} \begin{tabular}{|l|r|r|} \hline 56.62 & 73.70 & 94.60 \\ \hline 63.13 & 80.32 & 101.53 \\ \hline \end{tabular} \begin{tabular}{|r|r|r|} \hline 56.62 & 73.70 & 94.60 \\ \hline 63.13 & 80.32 & 101.53 \\ \hline 14.68 & 15.57 & 16.40 \\ \hline \end{tabular} 9.06 \begin{tabular}{|r|r|r|r|} \hline 49.00 & 63.13 & 80.32 & 101.53 \\ \hline 13.67 & 14.68 & 15.57 & 16.40 \\ \hline & & & \\ \hline & & & \\ \hline \end{tabular}
Step by Step Solution
There are 3 Steps involved in it

Get step-by-step solutions from verified subject matter experts